
Table of Contents
- Booking Holdings Intro & Set-Up
- Booking Holdings Company Origin & Business Model Overview
- Current Owner Earnings of Booking Holdings
- The Value Creation Engine
- Booking’s Moat: Is the Threat from AI Real?
- Case Study: ChatGPT’s Instant Checkout
- Management & Capital Allocation
- Putting it all together: Valuation & Intrinsic Value Discussion
- Conclusion, Catalysts & Portfolio Decision
Booking Holdings Intro & Set-Up
Booking Holdings Inc. is a US‐based online travel services company (or Online Travel Agency – OTA) headquartered in Norwalk, Connecticut.
It operates a portfolio of travel marketplaces and platforms that enable consumers to book hotels, flights, car rentals, restaurants, and other travel services worldwide.
Its common stock is listed on the NASDAQ under the ticker BKNG. The company’s revenue is primarily derived from facilitating travel reservations and related services.
Following recent talk about AI replacing most software businesses, Booking’s share price has lost about 30% and is currently trading at ~4,050 USD/share… enough reason to take a deeper look at the likely medium-term development of this very high-quality business.
Booking Holdings Company Origin & Business Model Overview
Booking Holdings traces its roots to 1997, when it was founded as Priceline.com, which became popular for its “Name Your Own Price” travel model.
A strategic pivot occurred after a series of acquisitions, most notably the 2005 purchase of Amsterdam-based Booking.com, which over time became the company’s dominant brand.
Over time, additional acquisitions such as Agoda (2007), KAYAK (2013), and OpenTable (2014) expanded Booking’s global travel and restaurant reservation ecosystem.
In 2018, the company finally rebranded from The Priceline Group to Booking Holdings to reflect the central role of Booking.com and its global marketplace footprint.

Today, the company’s key brands include:
- OTA marketplaces:
- Booking.com – the largest accommodation and travel reservation platform
- Priceline – US-focused travel marketplace
- Agoda – Asia-centric travel platform
- Metasearch business (aggregator): KAYAK
- Restaurant reservations: OpenTable
- Others: Rentalcars.com, Momondo, Cheapflights, and others
These brands target different markets, geographies, and customer segments.
Until recently, the company was mainly focused on facilitating hotels and alternative accommodations. Flights, ground transportation, and attractions have been deliberately expanded only in the past couple of years.
Top-Line Development
With its two-sided OTC marketplaces (Booking.com, Priceline, Agoda), Booking connects travelers on one side and hotels, airlines, rental car companies, restaurants, and sightseeing activity providers on the other.
For each “match”, i.e., hotel, airline, rental car booking, Booking Holdings receives a commission (= revenue).
This commission historically has been quite stable and equaled ~14% of gross bookings (one of the key KPIs tracked in Booking’s regular investor materials):
![Average commission fee Booking Holdings (= merchant and agency revenue / gross bookings) [%]; Source: Annual reports, TIKR](https://montaniumresearch.com/wp-content/uploads/2026/06/BKNG-4.png)
Figure 1: Average commission fee Booking Holdings (= merchant and agency revenue / gross bookings) [%]; Source: Annual reports, TIKR
Booking’s revenue (i.e., commissions) has grown at an average rate of ~10.7% pa over the past decade.
This growth has been driven by a combination of different factors:
- Global travel growth driven by a developing middle class in many emerging countries
- A gradual shift towards the online booking of trips
- Development of the “Connected Trip” and resulting shift to the Merchant Model – capturing more transaction value and controlling payments
- Investment in technology and data platforms – search, personalized recommendations, mobile apps
- Development of the Genius loyalty program – improving conversion and customer retention
- Expand network effects and scale – more listings attract more customers, and vice versa
- Bolt-on M&A/Acquisitions – expanding global reach and capabilities
![Revenue development Booking Holdings [USD billion]; Source: TIKR, BKNG reporting](https://montaniumresearch.com/wp-content/uploads/2026/06/BKNG-5.png)
Figure 2: Revenue development Booking Holdings [USD billion]; Source: TIKR, BKNG reporting
As of December 2025, the company had ~4.4 million properties on its website: 3.9 million so-called alternative accommodations and ~0.5 million hotels. (However, hotels contributed ~64% to gross bookings, alternative accommodations only ~36%.)
As of today, Booking Holdings is a Global company with three main regional footprints:
- Europe – historically a very large share, driven by Booking.com’s strong penetration.
- North America – significant contribution, particularly in higher-yield segments.
- Asia-Pacific & Rest of World – growing share, with local brands (particularly Agoda) expanding reach.
Regional breakdowns for revenues and employee numbers suggest that Europe currently accounts for ~45% of BKNG’s business, Asia Pacific for ~40%, the US for ~10%, and other regions for ~5%.
According to management’s comments, the company is currently the largest OTA in Asia (through the brands Agoda and Booking.com) and is growing its share in the US (where Expedia has historically had a strong position).
![Sales and employees by main geography (2025) [%]; Source: Company reports](https://montaniumresearch.com/wp-content/uploads/2026/06/BKNG-6.png)
Figure 3: Sales and employees by main geography (2025) [%]; Source: Company reports
However, it’s worth clarifying that Booking doesn’t have a significant presence in the two largest Asian economies, China and India. Although Booking is present in both markets, it has never been a dominant domestic OTA in either region. For different reasons:
- China: The Chinese market is largely controlled by local players such as Trip.com (Ctrip), Meituan, and Alibaba (through travel integration). Generally, China is a closed-loop “super-app” market, where performance marketing – one of Booking’s specialties – doesn’t yield any benefits. China’s travel market is also highly regulated, with strict data localization laws and oversight of foreign tech companies.
- India: Local players like MakeMyTrip, Goibibo, and OYO dominate the market. For Booking, lower monetization opportunities and intense price competition make the region economically less attractive.
The Connected Trip Vision: Merchant Replacing Agency Revenues
Booking today reports three main sources of revenue:
- Merchant Revenue
- Agency Revenue
- Advertising & Other
The first two sources refer to Booking’s OTA revenues.
The main distinguishing factor between the Merchant and Agency Model is how the payments are facilitated, and not, as the naming convention suggests, how revenue is recognized:
- Merchant Revenues (facilitated based on the Merchant Model) – Booking handles the payment and initially receives the full amount paid by the traveler (gross revenue or gross bookings). Then it holds the cash for a certain period of time – mostly until the actual stay – before transferring the net amount to the accommodation (and keeping the commission for itself). Ty doing so, Booking becomes the so-called “Merchant of Record”.
- Agency Revenues (facilitated based on the Agency Model) – Booking acts as intermediary; the hotel or airline invoices the traveler directly. Afterward, the hotel or airline pays Booking the commission.
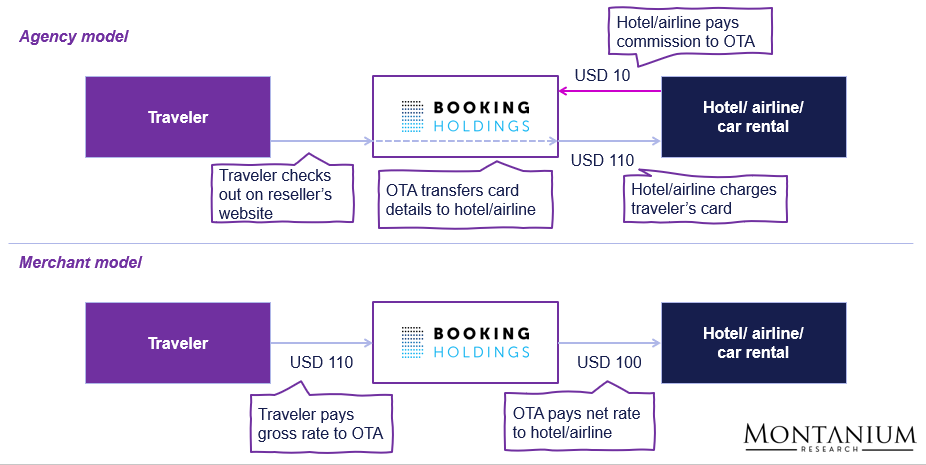
Figure 4: Functioning of the merchant and the agency model in online travel; Source: Websearch
Note regarding revenue recognition: Under ASC 606 (principal versus agent revenue), both models – Merchant and Agency – qualify as agent revenue, requiring Booking to recognize only the commission on the income statement, not gross bookings/gross revenue.
Over recent years, revenue via the Merchant Model has grown meaningfully, overtaking Agency revenue as the largest contributor and reflecting a strategic shift toward controlling payments and bundled offerings.
Figure 5: Revenue breakdown Booking Holdings; Source: BKNG reporting
The build-up of capabilities to sell bundled offerings is a direct result of Booking’s decision to expand into flight, rental car, and attraction bookings, thereby offering the “Connected Trip”.
We are executing against our long-term strategy to create an ideal AI-powered traveler experience, offering our customers relevant options and suggestions at the times and in the language they want them, making trips booked with us seamless, easy, and valuable. We refer to this as the “Connected Trip.” The goal of our Connected Trip vision is to offer a differentiated and personalized travel planning, booking, payment, and in-trip experience for each trip, enhanced by a robust loyalty program that provides value to travelers and partners across all trips. – Booking Holdings 10-K 2025 (page 2)
With the Connected Trip, Booking aims to offer travelers a one-stop solution for holiday planning. In practice, that means travelers book accommodation and receive suitable flights, rental cars, tours, etc., within the Booking ecosystem. Everything is in the local language and facilitated by the desired payment provider (as of today, Booking integrates more than 100 payment providers). Changes can be made instantly through the Booking.com app (and other apps).
As of 2025, Connected Trips – combined bookings across at least two verticals – accounted for a low double-digit percentage share.
Although the big three marketplaces (Booking.com, Priceline, Agoda) already offer the Connected Trip in theory (please see the following graphic from the 2025 10-K), they are still in the early innings of building up the required inventory.
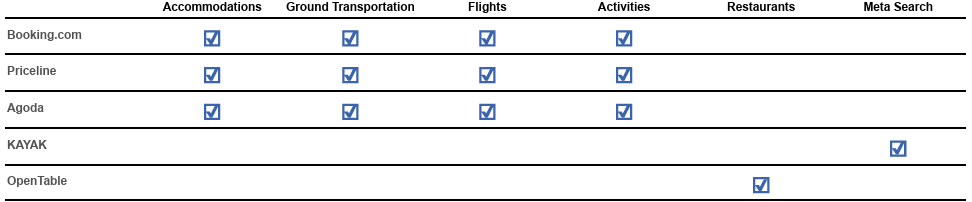
Figure 6: Current offering of Booking’s main brands; Source: Annual report 2025
For instance, in 2025, Booking reported a 37% YOY growth in flight tickets and an 80% YOY growth in attraction tickets. Room nights and rental car days grew by ~8% and 6%, respectively:
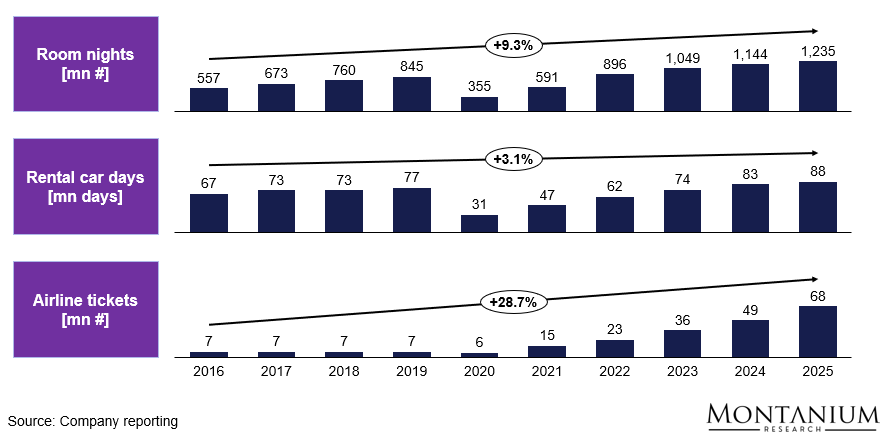
Figure 7: Key operational KPIs Booking Holdings; Source: Booking 10-Ks
By the way: As of today, advertising and other revenues are mainly earned by Booking’s non-OTA businesses, notably KAYAK and OpenTable. KAYAK primarily earns advertising revenue from metasearch (referral clicks), while OpenTable earns reservation fees from participating restaurants. Furthermore, smaller amounts are earned through facilitating travel insurance policies and ancillary offerings.
Asset-light Business Model with Growing Economies of Scale
Booking Holdings has, with the exception of 2020 (the first COVID year), consistently reported high profitability, with overall EBITDA margins historically in the low- to high-30% range (depending on the year and mix).
For example, Adj. EBITDA margins have been ~35% in recent periods, according to the latest 10-K and to data from financial data provider TIKR:
![EBITDA margins BKNG over time [%]; Source: Company reports](https://montaniumresearch.com/wp-content/uploads/2026/06/BKNG-11.png)
Figure 8: EBITDA margins over time [%]; Source: Company reports
As the company operates a very capital-light business model, it has earned pretty high (and increasing) returns on capital.
![ROIC comparison of OTAs [%]; Source: TIKR](https://montaniumresearch.com/wp-content/uploads/2026/06/BKNG-12.png)
Figure 9: ROIC comparison of OTAs [%]; Source: TIKR
Note: The graphic above is based on the following and simplified calculation methodology for calculating ROIC (taken from TIKR):
Return on Capital = EBIT / (Total Equity + Total Debt + Deferred Tax Liability)
So, TIKR basically calculates an unlevered pre-tax return on capital, assuming all cash is classified as operating cash (i.e., cash required to stay in the business to pay people, rent, marketing expenses, etc., and not to pay down debt or return to shareholders).
While we can easily argue about the calculation methodology (and we’re going to use a different definition of cash further down), the message should be clear: The business model and market positioning of Booking’s marketplaces are highly attractive, and returns on capital are superior to the majority of other businesses out there.
Next, we look at Booking’s current and future level of cash earnings available to shareholders (the so-called Owner Earnings).
Current Owner Earnings of Booking Holdings
Owner Earnings (according to Warren Buffett) are the sustainable, true cash flows that a business can distribute to its owners without harming its long-term competitive position.
The original definition comes from the 1986 Berkshire Hathaway Shareholder Letter:
Owner earnings represent (a) reported earnings plus (b) depreciation, depletion, amortization, and certain other non-cash charges less (c) the average annual amount of capitalized expenditures for plant and equipment, etc. that the business requires to fully maintain its long-term competitive position and its unit volume. – Warren Buffett, 1986
Short version:
Owner Earnings = Net Income + non-cash charges − Maintenance CapEx
or
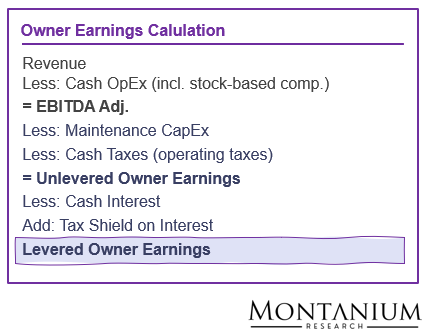
Figure 10: Owner Earnings definition
In plain English: Levered Owner Earnings represent the cash that actually belongs to the owners, after spending what is necessary to keep the business running at its current level.
Note: We’re taking a long-term perspective here, suggesting that Maintenance CapEx will eventually equal depreciation, resulting in identical tax shields for those items. In reality, Maintenance CapEx, particularly for a high-growth business, will likely be below depreciation expense for quite some time, so with our tax calculation, we typically take a more conservative stance.
Operating Returns
As mentioned before, for 2025, Booking reported an EBITDA margin of ~35% on total revenues of ~USD 27 billion.
A closer look at the P&L reveals that there are essentially three major cost items:
- Marketing costs (making up ~30% of revenue): These costs mainly include expenses for marketing campaigns for brand building and the strategic use of performance marketing spend (basically Google and social media ad placements to drive traffic to Booking’s websites and apps). In more detail, performance marketing costs primarily consist of search engine keyword purchases, affiliate programs, referrals from meta-search websites, and other performance-based marketing channels, including social media marketing. Marketing costs are highly variable.
- Sales costs (responsible for ~13% of revenue): Sales costs are typically variable and include credit card and other payment processing fees associated with merchant transactions, fees paid to third parties that provide call center and other customer services, digital services taxes and other similar taxes, chargeback provisions and fraud prevention expenses associated with merchant transactions, provisions for expected credit losses, mostly related to accommodation commission receivables, and customer relations costs.
- Personnel expenses (~13% of revenue): Booking employs ~24,300 people at an average compensation (incl. salaries, bonuses, health benefits, stock-based compensation, payroll taxes etc.) of USD 140,000 pa.
![P&L Booking Holdings 2025 [USD million]; Source: Booking Holdings annual report 2025](https://montaniumresearch.com/wp-content/uploads/2026/06/BKNG-14.png)
Figure 11: P&L Booking Holdings 2025 [USD million]; Source: Booking Holdings annual report 2025
If we take into account the USD 457 million impairment that took place at KAYAK in 2025 (USD 180 million goodwill and USD 277 million trade names, supply and distribution agreements) and ~USD 205 million in one-time restructuring costs, the EBIT to EBITDA Adj. bridge basically looks like this:
![EBITDA Adj. calculation Booking Holdings (2025) [USD million]](https://montaniumresearch.com/wp-content/uploads/2026/06/BKNG-15.png)
Figure 12: EBITDA Adj. calculation Booking Holdings (2025) [USD million]
So, EBITDA, corrected for any one-time effects, stood at ~USD 9.9 billion in 2025, corresponding to an EBITDA Adj. margin of close to 38%.
Note that, although we’re interested in looking at “Cash” EBITDA only, we have not added back share-based compensation expense, as, like Warren Buffett, we consider it a real cost to be considered in any Owner Earnings calculation.
Interest on Operating Cash
At first glance, it appears that BKNG has substantially more cash on its balance sheet than warranted (in 2025, the company had an average of ~USD 16.7 billion in cash and ~USD 18.2 billion in financial liabilities sitting on its balance sheet).
When looking at it in a bit more detail and listening to management’s comments, there seem to be a couple of reasons for this.
Reasons to hold more operating cash (safety viewpoint):
- Safety cushion (operational buffer): Keeping a high level of cash ensures that even if the travel market freezes again (like in 2020), Booking doesn’t have to tap the markets when credit is tight.
- Merchant float: As outlined above, Booking has pivoted aggressively to the Merchant Model in recent years, in which Booking collects money from customers upfront and pays the hotel later. This creates a massive “float” of cash (cash that doesn’t belong to Booking). Because Booking is now the “Merchant of Record” for over USD 130 billion in annual bookings, it needs significant liquidity to process payments, issue refunds, and make payouts to millions of global partners across multiple currencies.
Reasons to hold more excess cash (capital allocation viewpoint):
- Global Cash Friction: Even though “restricted cash” is minor for BKNG, a large portion of its cash is held by foreign subsidiaries. While US tax laws (like the TCJA) made repatriating cash easier, it’s still often more efficient to fund US-based share buybacks with cheap debt rather than incurring the frictional costs of constantly moving cash from Europe and Asia to the US.
- Net Neutrality: By keeping cash levels roughly equal to debt, Booking maintains a “Net Debt” of near zero. This keeps its credit rating high (allowing it to keep borrowing cheaply) while the reduced share count aggressively drives up Adjusted EPS.
- M&A Readiness: Booking has a history of strategic acquisitions. Having immediate cash on hand might allow it to move faster than the competition if an attractive opportunity opens up.
In the case of Booking, we looked at three typical approaches to estimate operating cash:
- The 2% of revenue rule
- The long-term minimum cash the company held (as a % of revenue)
- The bottom-up approach considering an operational buffer consisting of ~4 months of personnel and G&A cost and ~1 month of sales expenses (excl. Marketing), as well as a buffer to cover the merchant float
![Operating cash estimates [USD million]; Source: Own calculations](https://montaniumresearch.com/wp-content/uploads/2026/06/BKNG-16.png)
Figure 13: Operating cash estimates [USD million]; Source: Own calculations
To stay on the conservative side, we estimated operating cash to be ~USD 7 billion (~USD 1.7 billion to cover unforeseen volatility of cash inflows and ~USD 5.3 billion to cover the merchant float owed to hotels, airlines, etc.).
This means we need to treat these ~USD 7 billion as part of working capital, and the associated interest income as operating profit contributing to Owner Earnings.
Although the average interest rate earned on available cash in 2025 was ~5.5%, we assume interest rates will be lower in the future than they have been in the recent past. Based on the current 3-month Treasury yield, we assume an interest rate of ~3.6% going forward.
As a result, the contribution to operating earnings would be ~USD 250 million.
Maintenance CapEx
Assessing Maintenance CapEx is one of the key challenges when estimating Owner Earnings.
As a recap: Maintenance CapEx is the investment required to just maintain (not grow) the existing business/profitability level.
Over time, we have investigated 5 different methods to divide CapEx into its growth and its maintenance components:
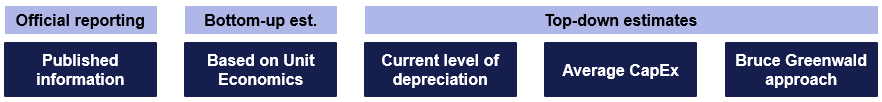
Figure 14: Different approaches to estimate Maintenance and Growth CapEx
Estimating Maintenance CapEx is particularly difficult for companies that exhibit high “structural” revenue growth, i.e., those capable of growing revenue virtually without associated CapEx.
Booking Holdings is such a case.
The company needs to continually reinvest in its marketplace software, integrate new features (most likely AI chatbots and AI search functionality), and keep systems up to date.
However, in many cases, actual revenue growth does not depend primarily on these investments (and the question is always whether a certain expense actually needs to be capitalized at all).
Of course, there might be long-term pressure on revenue levels if the user experience deteriorates and is no longer state-of-the-art, but in many cases, there is probably no direct relationship between CapEx and revenue growth (unlike for a restaurant or DIY store chain).
One could say that, in Booking’s case, CapEx is the enabler of future revenue growth.
Therefore, we believe it would be most sensible to treat all Capital Expenditures as “maintenance-like” and assume that a constant share of revenue is reinvested into the business, also in a “no-growth” scenario.
Over the past decade, the company spent ~2.1% of aggregate revenues on investments in Property, Plant & Equipment and intangible assets. Approximately 1.3% was spent on acquisitions (very lumpy across years).
By comparison, depreciation expense was ~4.5% of revenue over the same period.
![Aggregate investments Booking Holdings 2016-25 [USD million]; Source: Annual reports, TIKR](https://montaniumresearch.com/wp-content/uploads/2026/06/BKNG-18.png)
Figure 15: Aggregate investments Booking Holdings 2016-25 [USD million]; Source: Annual reports, TIKR
Based on these numbers, a key question arises: Are the upcoming changes (the implementation of AI) significant enough to drive elevated CapEx levels going forward?
If that’s likely to be the case, CapEx intensity in the medium- to long-term could potentially be closer to the level of depreciation (which still reflects the higher initial infrastructure investments of the past).
From our perspective, AI investments on the one hand and AI benefits on the other hand should be a wash, so that CapEx spending of 2.0% of revenue to maintain the business seems plausible.
Levered Owner Earnings
As a first step, we calculate unlevered Owner Earnings (UOE) by adding interest on operating cash and deducting Maintenance CapEx and Operating Taxes from EBITDA using the above estimations and the standard US Tax Rate of ~21% (which is very close to the reported Tax Rate for fiscal year 2025):
UOE = (USD 10,110 mn + USD 250 mn – USD 540 mn) x (1 – 21%) = ~USD 7,800 mn
Next, we need to consider leverage and interest payments (including the partial tax shield offset).
Again, we need to ask what the „right“ interest rate on the outstanding interest-bearing debt (corrected for the available excess cash) would be.
For 2025, total interest-bearing debt (incl. leasing liabilities) averaged ~USD 18.2 billion, while excess cash was ~USD 10.3 billion (based on our previous calculation).
This yields an average net debt of ~USD 7.9 billion for 2025.
From the published information on the outstanding unsecured and nonconvertible notes, we know that the average coupon is ~3.6%. On top of that, there’s a certain amortization of debt discounts. However, based on the reported principal and carrying values of the debt, this should only be a minor factor. Taking into account the interest rate earned on excess cash (which is likely going to be below the interest rate on debt over the longer term), we estimate the interest cost on net debt to be ~5.9%.
Thus, current levered Owner Earnings (LOE) are conservatively estimated to be ~USD 7,400 million:
LOE = UOE – Interest + Tax Shield on Interest = USD 7,600 mn – USD 465 mn x (1 – 21%) = ~USD 7,400 million
So basically, if the company was sold today without pricing in future growth, it would (or should) be priced off this sustainable earnings number available to company owners.
![Current level of Owner Earnings calculation Booking Holdings [USD million]; Source: Own calculations](https://montaniumresearch.com/wp-content/uploads/2026/06/BKNG-19.png)
Figure 16: Current level of Owner Earnings calculation Booking Holdings [USD million]; Source: Own calculations
Next, we need to ask ourselves what a realistic growth rate for Owner Earnings would be for the company… and how attractive this potential growth is from a shareholder return perspective.
The Value Creation Engine
When assessing a company’s growth mechanics, the key question is not simply how fast revenues or earnings are increasing, but how efficiently incremental capital is deployed.
What ultimately determines the quality and sustainability of growth is the incremental return on invested capital (IROIC or ROIIC) – that is, the return the company earns on each additional USD reinvested into the business.
A high incremental ROIC indicates that growth is value-creating, as each unit of new capital generates disproportionate economic profit, whereas a low incremental ROIC suggests that growth may be dilutive, even if headline growth rates appear attractive.
In this sense, growth only creates shareholder value if it is accompanied by superior returns on incremental invested capital.
In this regard, it is important to distinguish between different sources of growth – structural growth and “capital-driven” growth:
- Structural growth: Growth happening as a result of industry-wide developments or industry structure, in this case, mainly the continued growth of Global travel and the increase of online penetration over time, but also the active acquisition of new supply with respect to alternative accommodations or attractions, and the continued use of performance marketing instruments to drive new customers to the platform. These will, by default, likely lead to continued revenue growth and margin expansion due to the business’s high degree of operating leverage (“economies of scale”).
- Capital-driven growth: Growth happening as a result of dedicated investments, either through the cash flow statement (growth CapEx in the classical sense), or through the P&L (CapEx-like expenses leading to revenue and profit growth down the line).
So, what does the “growth engine” look like for Booking Holdings?
Booking’s CFO Ewout Steenbergen explains Booking’s growth recipe in the following way:
Over the medium term, the company aims for an average revenue growth of ~8% pa, low double-digit profit, and EPS growth of 15% pa. The reasoning behind why this level of growth is achievable for a company like Booking Holdings is as follows:
First: The travel industry typically grows at a higher rate than GDP. People, once they have more money to spend, will likely spend it on leisure activities (including travel). This fact is also illustrated quite nicely on the following graphic from Airbus’s Global Market Outlook (which also shows that many countries still have a lot of room to grow over the next few decades):
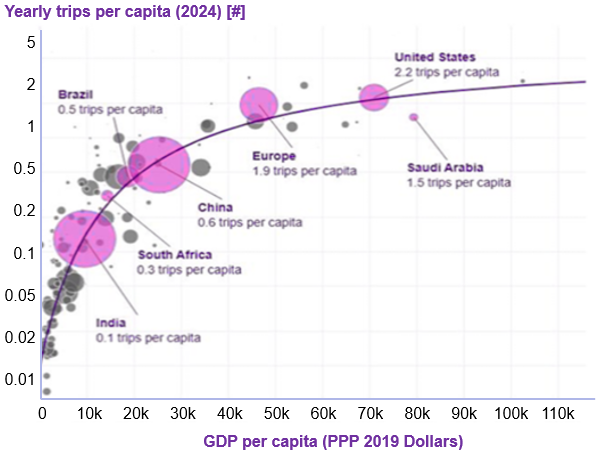
Figure 17: Yearly trips per capita versus GDP per capita; Source: Airbus GMO 2025
Although industry forecasts vary by institution and scope, Amadeus IT Group, for instance, the Global IT database provider to the travel industry, forecasts total Global travel market growth of ~3.7% until 2035. Online bookings are expected to grow by ~7-9% according to some other sources (e.g., FMR).
Second: Booking should be able to grow faster than the travel industry, because, although being the largest OTA globally, it still has some idiosyncratic growth opportunities:
- As the largest player in Asia, Booking is in the best position to benefit from the above-average growth in the region.
- In the US, Booking, with its below-average market share, is in the position of a “challenger”. The aim is to outgrow the market until it reaches its fair share (in 2025, US growth has already clearly outpaced regional market growth)
- Booking is still expanding in a number of verticals, such as airline tickets, attractions, or rental cars. Together with the arising cross-selling opportunities (the “Connected Trip”), this should lead to meaningful additional growth.
The Asia Growth Story
As mentioned earlier, Asia is currently the fastest-growing region in Global travel, and it is likely to remain so over the next decade.
Given its presence across two brands, Agoda and Booking.com, Booking is well-positioned to capture a substantial share of the region’s above-average growth.
Booking’s main brand in Asia is Agoda, which, at its roots, is an Asian company (headquartered in Singapore). It has its operating base in Bangkok, Thailand, and is led by a local management team. As a result, Agoda has a strong focus on localization. In each country where it operates, its UX, payment options, advertising campaigns, etc., match the local requirements. This gives the brand a meaningful advantage over other OTA competitors.
With its Global brand, Booking.com, Booking is focusing more on outbound travelers (e.g., people who want to travel from Asia to Europe or the US), for whom it obviously has an attractive offering. Like Agoda, Booking.com is also investing in local payment options to simplify access for local customers.
Catching up in the US
The US market is still growing at a low single-digit rate, much lower than the low double-digit growth Booking has posted recently.
The main reasons:
- Booking saw some opportunities for optimized performance marketing (probably a one-time effect).
- Growth in B2B was substantial (where Booking distributes through another partner, like a credit card company or an airline).
- Booking’s direct sales channels (either App or Booking website) showed meaningful growth.
In particular, the last development is a positive indicator, as it typically requires a well-known brand, which, in turn, typically requires many years of marketing investment.
This development suggests that Booking might have reached a tipping point in the US.
Other Strategic Initiatives
Apart from those top-priority growth areas, the company has a set of strategic initiatives that should lead to further (top-line) growth down the line, such as
- Further optimization of performance marketing (e.g., Social Media, in the future also LLMs potentially)
- Further expansion of alternative accommodations
- Further shift towards the Merchant Model
- Creation of more personalized offerings (through the use of agentic AI)
- Growth of fintech and payment solutions
- Monetization through ad placements
- Further expansion of the Genius loyalty program
All these measures, combined, should allow Booking to capture a few more percentage points of top- and bottom-line growth.
So in summary, the target of achieving 8% revenue and profit growth over the next couple of years seems more than realistic to us.
CapEx intensity of Future Growth Investments
Importantly, the majority of the growth initiatives are unlikely to require substantial CapEx in the classical sense (i.e., investments capitalized on the balance sheet) but will instead require “investments” through the P&L, such as incremental marketing and IT spending, personnel build-up, etc.
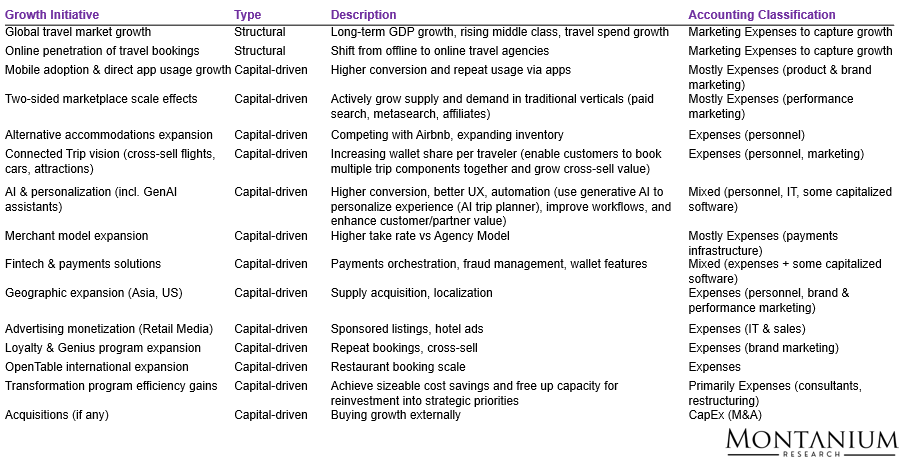
Figure 18: Growth drivers Booking Holdings; Source: Company, own compilation
These incremental expenses – according to Booking – will be funded to a large extent by the improvements resulting from the ongoing transformation program (which should yield ~USD 500-550 million of sustainable cost savings in 2026), as well as by the ongoing capture of fixed cost leverage as the business continues to grow.
In simplified terms, this means that Booking doesn’t see any margin compression resulting from the additional investments. On the contrary, Booking believes EBITDA margins will likely expand by ~50 bps as a result of the 2026 investments.
Here’s the corresponding paragraph from the latest earnings call transcript:
We expect the transformation program to deliver in-year savings of USD 500 mn to USD 550 mn in 2026 […]. Beyond the transformation program, we aim to drive additional efficiencies in our ongoing operations through both marketing and fixed operating expense leverage. With the capacity created by these savings and efficiencies, we are reinvesting about USD 700 mn above our baseline investments in 2026 into areas such as progressing our Gen AI capabilities, advancing our connected trip vision, growing in Asia and the U.S., growing our advertising business, OpenTable’s international expansion, and expanding our fintech and loyalty offerings.
[…] We expect the reinvestments in 2025 and 2026 will help us to deliver constant currency gross bookings and revenue growth that is about 100 basis points faster than our long-term growth ambition of 8% while expanding adjusted EBITDA margins by approximately 50 basis points.
– Booking Holdings Earnings Call, Feb 18, 2026
In summary, this indicates that only minimal CapEx is needed to achieve the additional growth.
Booking’s Moat: Is the Threat from AI Real?
First of all, over the past roughly two decades, Booking has built a pretty wide moat around its business model.
The company operates some of the largest two-sided marketplaces in an industry that, excluding China and India, is dominated by very few large players (Booking, Airbnb, Expedia). The barriers to entry into this market are significant.
Still, Booking’s stock price development in recent weeks suggests the market believes that AI poses a real threat. So what does it take to disintermediate a company like Booking or Airbnb?
To compete with the large OTAs, a new (AI) entrant would basically need to (amongst other things)
- Build inventory: Suppliers (hotels, etc.) likely won’t move unless the economics they get are more attractive (lower commissions). That pressures margins early on. The depth of inventory in large cities like Paris, New York, and Rome is also important. A Global footprint alone is not enough.
- Build demand, i.e., outspend on brand and performance marketing (or find an attractive new channel): Incumbents dominate paid search, metasearch, and app traffic. Customers won’t easily switch to a brand they don’t trust. A challenger will likely need to absorb massive CAC losses for an extended period.
- Build required IT infrastructure: Becoming the Merchant of Record requires building payment solutions (Booking has implemented more than 100 different payment options globally), fraud prevention and chargeback mechanisms, a review system, insurance products, dispute resolution workflows, customer care units, etc.
- Build legal and regulatory infrastructure: To operate globally, a competitor would need to establish local subsidiaries with the corresponding legal entities, staff, risk managment systems, etc.
- Create differentiation beyond price: Just 20% better is typically not enough to persuade customers to switch from their preferred booking Apps/sites. So the challenger would need a substantially better offering.
- ...
From our perspective, becoming the Merchant of Record, establishing the regulatory infrastructure, and aggregating demand will likely be the most challenging tasks for an AI to accomplish. And most importantly, a lot of what is required here seems to be quite far away from AI’s original value proposition.
Therefore, we believe that it will be quite unlikely that AI will try to become the Merchant of Record in the OTA market.
Instead, there are indications that LLMs will become an additional distribution channel/interface for customers, with access to Booking’s inventory via Booking’s API (same effect, but much cheaper for the AI to implement).
This basically resonates quite well with what NVIDIA CEO Jensen Huang recently said about the threat to software from Agentic AI:
Remember what software is? Software is a tool. There’s this notion that the tool industry is in decline and will be replaced by AI. You could tell because there’s a whole bunch of software companies whose stock prices are under a lot of pressure because somehow AI is going to replace them. It is the most illogical thing in the world, and time will prove itself. […] If you were a artificial general intelligence, would you use the tools like Service Now and SAP and Cadence and Synopsis or would you reinvent a calculator? Of course, you would just use a calculator. That’s the reason why the latest breakthroughs in AI is what? Tool use! – Jensen Huang, CEO of NVIDIA, at the CISCO AI Summit
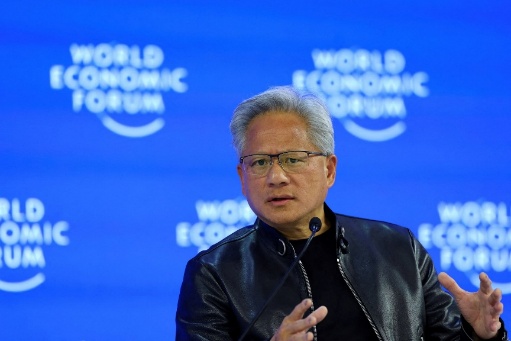
Figure 19: NVIDIA CEO Jensen Huang; Source: YouTube
Case Study: ChatGPT’s Instant Checkout
In the United States, ChatGPT has begun rolling out Instant Checkout, a feature that lets users discover and purchase products directly in the chat interface without being redirected to an external website.
Instead of acting purely as a recommendation engine, ChatGPT can now function as a transactional layer between consumers and participating merchants. When a supported product is shown, users see a native “Buy” button, complete the checkout within ChatGPT, and the order is then processed by the merchant. Technically, this functionality is enabled by the Agentic Commerce Protocol (ACP) – an open standard that enables AI systems to securely communicate with merchant backends for pricing, availability, and order processing.
ACP works in combination with established payment infrastructure providers, such as Stripe, to ensure secure payment processing and compliance. In essence, Instant Checkout represents a shift from AI-assisted product search to AI-enabled commerce, with the US currently serving as the live test market for this integration.
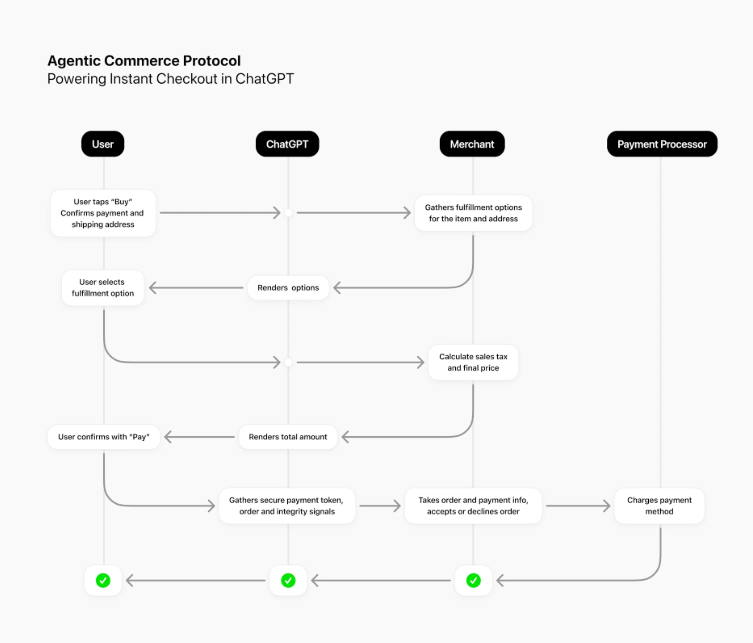
Figure 20: Overview of ChatGPT’s Instant Checkout process; Source: OpenAI
Example
If Instant Checkout is enabled for a merchant like SKIMS, the purchasing experience inside ChatGPT would feel very natural and conversational rather than technical or transactional.
You would start exactly as you normally would — by asking a question. For example: “Show me women’s sportswear from SKIMS” or “What workout leggings does SKIMS offer?” ChatGPT would interpret this as shopping intent and display a curated selection of relevant products directly in the chat. Each product listing would typically include an image, the product name, price, a short description, and available sizes or color options.
If SKIMS supports Instant Checkout in your region, you would see a “Buy” button directly within the chat interface next to the product. Instead of being redirected to the SKIMS website, clicking that button would open a secure checkout window inside ChatGPT itself. There, you would see an order summary with the selected item, pricing details, shipping options, and your delivery address. You could confirm or edit your shipping information and choose a payment method, such as a saved credit card or a supported digital wallet.
Once you confirm the payment, the transaction is completed within ChatGPT, but the order is processed by SKIMS. You would receive an email confirmation from the merchant, and all logistics – shipping, tracking, returns, or customer service – would be handled directly by SKIMS, just as if you had purchased on their website.
From a user perspective, the key difference is that the entire discovery and checkout process happens seamlessly inside the chat interface, without switching tabs or navigating external sites.
Still, ChatGPT is not acting as the Merchant of Record but as the facilitator of the transaction.
Management & Capital Allocation
Key personnel at Booking Holdings have decades of experience in the travel industry, particularly with the Company.
Glenn Fogel has served as CEO and President of Booking Holdings since January 2017 and as CEO of Booking.com since June 2019. He previously held roles as Head of Worldwide Strategy and Planning and Executive Vice President of Corporate Development. Fogel joined the company in 2000 after working as a trader at a global asset management firm and earlier as an investment banker specializing in the airline industry. During his tenure at the company, Vogel basically led the acquisitions of Booking.com, KAYAK, OpenTable, RentalCars.com, and Agoda.com.
All brand leaders have spent at least 10 years with the company.
Ewout Steenbergen has served as Booking’s CFO since March 2024. Prior to joining the company, he was CFO of S&P Global. Earlier in his career, he served as CFO of Voya Financial.
So, virtually the whole management team has contributed to the company’s positive development over the past ~10 years, at least… and the success speaks for itself.
When looking at Booking’s capital allocation strategy, two things stand out:
- The majority of Free Cash Flow is used to buy back its own stock
- Over time, debt has been used to some extent to finance buybacks (i.e., despite vastly positive cash flow, more debt was issued than repaid)
![Sources and uses of cash Booking Holdings [USD million]; Source: TIKR](https://montaniumresearch.com/wp-content/uploads/2026/06/BKNG-23.png)
Figure 21: Sources and uses of cash Booking Holdings [USD million]; Source: TIKR
During the fireside chat at the 53rd Annual Nasdaq Investor Conference 2025, CFO Ewout Steenbergen provided some additional details on the capital allocation policy, particularly the strategy around share buybacks:
We are actively returning capital to shareholders. We do that through dividends and buybacks. The buybacks have a structural element to it, a systematic element in it. And then there is also a little bit of a tactical element to it. So we scale up and down by quarter based on the 10b5-1 grid, and there is price sensitivity in that grid. So you saw that levels were slowing down a little bit, or by USD 700 million in the third quarter. But then, when there is a dislocation of the share price, according to the grid that we put in place, there is really quite a large increase in the daily buyback volume. – Ewout Steenbergen at the 53rd Annual Nasdaq Investor Conference
What he’s basically saying: Booking has a commitment to buy back its own shares regularly, but it has some degrees of freedom to buy more when the share price is low and vice versa… and the so-called 10b5-1 plan is in place to guide the trading.
Over the past couple of years, Booking has bought back so many shares that its equity has become negative.
Putting it all together: Valuation & Intrinsic Value Discussion
Based on the existing growth initiatives and opportunities, the durability of the existing moat, and given the tenure and capital allocation skills of management, we have constructed three different scenarios to understand the potential outcomes for a prospective investor in the stock of Booking Holdings:
- Dark Clouds: One or more LLMs start competing directly with Booking (i.e., they become the Merchant of Record and build inventory, payment solutions, customer care, etc.) and are able to disintermediate Booking and its competitors, leading to shrinking market shares and fixed cost deleverage effects.
- Realistic: Growth can be realized as planned (top line growth 8% pa), OTAs continue to be the Merchant of Record in travel, and LLMs develop into an additional distribution channel for Booking (similar to Google Search). Margin continues to expand slightly (by ~50-75 bps pa) and management continues to use share buybacks aggressively to return capital to shareholders.
- Blue Sky: Booking is able to take away significant market share from competition (top line growth 12-14% pa). Increased diversification of distribution channels (Google plus several LLMs) will lead to lower performance marketing cost, economies of scale expand meaningfully, and management continues share buybacks.
Here are the corresponding key KPIs:
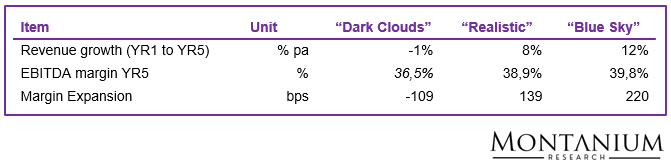
Figure 22: Main scenario assumptions; Source: Own assumptions
The graphic below shows the model results for Owner Earnings growth for the three different scenarios.
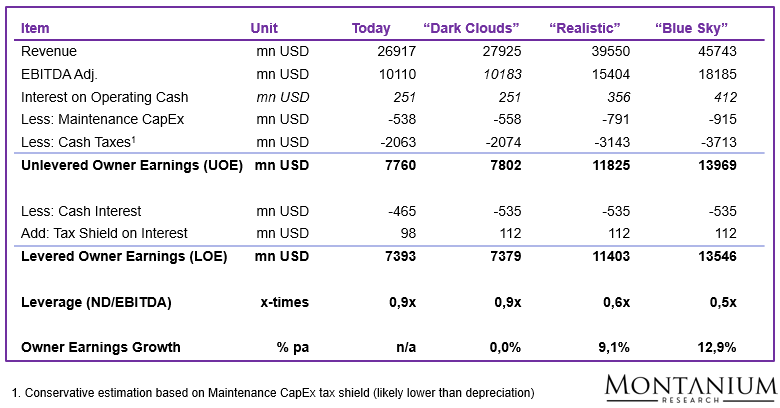
Figure 23: BKNG Owner Earnings by YR5; Source: Own calculations
Now, how do we interpret the table?
We observe that levered Owner Earnings would increase to ~USD 11.4 billion in the realistic case, corresponding to a ~9% IRR over 5 years, assuming the market’s valuation multiple remains largely unchanged. In the optimistic “Blue Sky” scenario, IRR could even increase to ~13%, while in our conservative “Dark Clouds” scenario, we’d see no annual growth in Owner Earnings.
Now, what does this all mean for the per-share equity value?
First of all, if there are no expectations of change in the (Owner) Earnings multiple, nor any dividend payments or other equity transactions like buybacks or rights issues, then the growth rate in levered Owner Earnings should directly reflect the IRR achievable from this investment.
However, since Booking returns a large portion of free cash to shareholders through buybacks and dividends, and we expect significant changes in the valuation multiple, the expected return on the investment differs materially from Owner Earnings growth alone.
Before we look at the results, let’s therefore spend some time putting the exit multiple assumptions into perspective.
The current EV multiple of ~14.5x EBITDA is on the low end of the historical range. The historical median has been around 18x EBITDA.
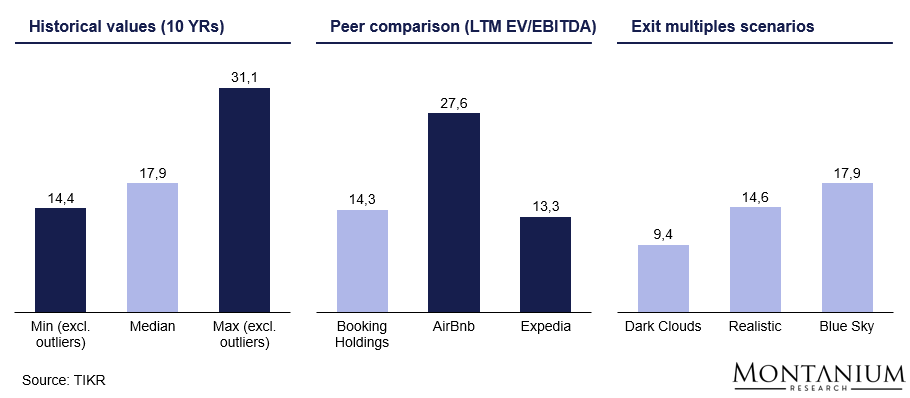
Figure 26: Comparison of EV/EBITDA multiples BKNG; Source: TIKR, own assumptions
Now, for our valuation, we have assumed the following exit multiples in year 5:
- “Dark Clouds”: Multiple contraction to ~9.5x EBITDA
- “Realistic”: Almost stable multiple at ~14.5x EBITDA (conservatively set at the low end of the historical range)
- “Blue Sky”: Multiple expansion to ~18x EBITDA (historical median)
These exit multiple assumptions lead to the following per-share values and IRRs for the different scenarios:
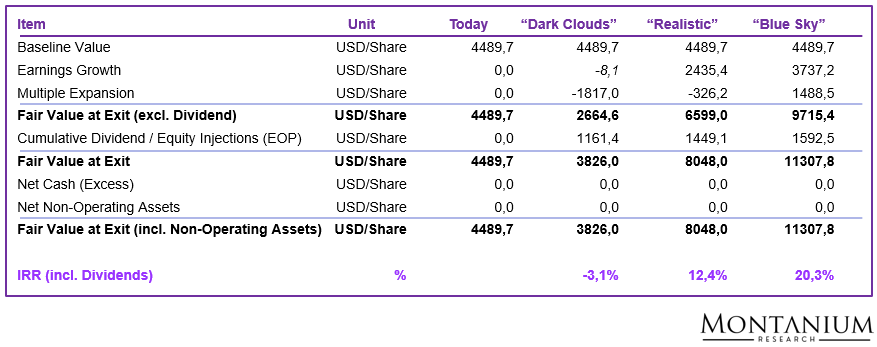
Figure 24: Per-share valuation Booking Holdings; Source: Own calculations
So if the “Dark Cloud” scenario materializes, we’d lose ~3.1% per year with the investment. In the “Realistic” scenario, we’d earn a decent 12.4% return pa, in the “Blue Sky” scenario, the investment would return more than 20% pa.
Here’s a more visual presentation of the logic for the “Realistic” scenario:
![Return decomposition BKNG (exit in 5 years) [USD/share]; Source: Own estimations](https://montaniumresearch.com/wp-content/uploads/2026/06/BKNG-28.png)
Figure 25: Return decomposition BKNG (exit in 5 years) [USD/share]; Source: Own estimations
It should be noted that only last week, the BKNG share price still stood at ~ 3,800 USD/share (now ~4,500 USD/share). A return to such price levels would immediately add ~400 bps pa to our return estimates.
Now, how likely do we think the different scenarios are? Based on what we know, we’d assign a low 10% probability to the “Dark Clouds” scenario. The “Blue Sky” scenario gets ~20%, the “Realistic” scenario the remaining 70%.
This leaves us with a weighted average IRR of ~13% pa, considering the probabilities of realization.
Conclusion, Catalysts & Portfolio Decision
Given current industry tailwinds (travel growth typically above GDP growth) and Booking Holdings’ idiosyncratic growth opportunities (particularly in Asia presence, other verticals, AI efficiency, and advertising), we believe a double-digit return over the next 3-5 years is entirely possible.
Generally, we believe that the continued growth of Owner Earnings will, by itself, lead to a rising share price. Management around Glenn Vogel now has a >10-year track record of building and growing the company at attractive rates (with a long-term mindset).
Additionally, there’s reason to believe that we’ll see meaningful multiple expansion once the dust settles and it becomes clear that AI is an enhancement rather than a threat to Booking’s business model.
From today’s perspective, fears of AI disintermediation seem unjustified, given the responsibilities involved in serving as the Merchant of Record and the effort required to replicate the business model that Booking spent decades building.
After all, ChatGPT has already made steps towards the direction of becoming a horizontal interface:
- It has introduced the “Instant Checkout” function, allowing customers to buy products without leaving the ChatGPT interface. The important thing: Purchase contract, payment etc. is still facilitated between the customer and the respective merchant/shop (e.g., Booking.com).
- It has taken steps to integrate the Booking offer into its ecosystem (app store)
It’s a bit unfortunate that the share price hasn’t remained below 4,000 USD/share for a longer period. Nevertheless, a share price of 4,500 USD/share looks attractive enough to initiate a starting position of, let’s say, 2-3% of the portfolio.