Table of Contents
- Executive Summary
- Industry Context, Company Basics, and Characteristics of the Business Model
- Current Positioning, and Earnings Power
- Recent Corporate Developments: “Takeover” of Liberty Broadband and Merger with Cox Communications
- Current Operational Themes: Sustained Broadband and Video Subscriber Losses, Growth in Mobile
- Investment Thesis
- Challenge #1: Competition through Fiber Optics
- Challenge #2: Competition from Fixed Wireless Access (FWA)
- Opportunity #1: Growth in Rural Areas
- Opportunity #2: Growth in Mobile
- Opportunity #3: Reduced Video Churn
- Pricing Power: Growing ARPU over time
- Leveling out of Growth and Upgrade Investments starting 2027
- Capital Allocation: Potential Share Buybacks
- Bringing it all Together: Valuation Scenarios and Potential Upside
- Potential Catalysts and Risk Factors
- Disclaimer
- Disclosure
- Glossary
Executive Summary
Charter Communications is one of the largest US cable operators, generating about USD 3.6 billion in levered after-tax free cash flow (FCF) annually (equal to ~26 USD/share). After the merger with Cox Communications is closed, FCF is expected to increase to approximately USD 5.7 billion, including the capture of cost synergies (resulting in approximately 29 USD/share due to the higher share count).
The market’s focus on near-term broadband subscriber losses and competition from Fixed Wireless Access (FWA) has depressed sentiment, but we see this as overdone. Our analysis suggests that Charter’s competitive positioning, bundling strategy, and long-term cash generation capability are underappreciated by the market.
From our perspective, key drivers of upside include:
- Subscriber stabilization: Competitive threats from fiber and Fixed Wireless Access (FWA) are overstated; economics and capacity constraints favor cable incumbents
- Rural buildout & mobile growth: 500k new passings and growing mobile penetration will drive account economics and stickiness
- ARPU expansion: Product bundling and limited competition in many markets should support a steady 2% per year pricing growth (~USD 2–3 billion in incremental EBITDA over five years)
- CapEx normalization: As rural expansion CapEx winds down post-2027, freeing up ~USD 4–5 billion annually, FCF is expectedf to nearly double
- Tax benefit: In the short-term, new tax rules will likely increase FCF by another ~10 USD/share (not factored into our valuation as not sustainable)
- Share buybacks: Absent other growth opportunities we expect Charter to buy back up to 65 million shares over the next ~5 years (reducing share count by more than 30%)
As a result, by ~2030, we estimate ~USD 10 billion in FCF on ~135–175 million shares, implying ~55–75 USD/share. At the current ~10x FCF multiple, this equates to a share price of 550–750 USD, with a potential re-rating to 690–930 USD if market sentiment improves (a 2.5–3.5x opportunity over our typical 5-year horizon).
We expect the thesis to gain traction as CapEx rolls off from 2027 onward and broadband trends stabilize, though investors will need patience for the FCF inflection.
Industry Context, Company Basics, and Characteristics of the Business Model
Charter Communications, Inc. is one of the largest cable operators in the United States, with a network footprint that stretches across the East Coast, Texas, and several key West Coast states such as Oregon and California.
Charter’s core business is providing network access to residential, small business, and enterprise customers. Its offering includes traditional linear TV packages—now enhanced with preferential access to major streaming platforms such as Disney+, Hulu, HBO Max, Peacock, and Paramount+—as well as high-speed broadband internet, landline phone, and mobile services.
The company’s origins and business model are best understood within the context of the development of the US cable industry. In the 1970s, most cable systems were small, undercapitalized startups. Their main role at the time was to retransmit TV signals from the three major national broadcasters—ABC, NBC, and CBS—before later expanding to carry programming from emerging cable channels, including HBO, Showtime, WTBS, ESPN, CNN, Nickelodeon, MTV, and others.
The fundamental logic of cable distribution has remained consistent for decades: programming is transmitted via satellite to regional head stations (“headends”) and then delivered to households through local access networks.
What has changed dramatically is the underlying infrastructure. The cable industry has steadily upgraded from legacy TV lines and coaxial cabling to fiber-dense networks. Today, more than 99% of Charter’s footprint is fiber-based, with coaxial cable used only for the short “last mile” (the “drop”) into customers’ homes.
A lot of people think about us as HFC or even coax on the drop, but over 99% of our footprint is really fiber-based. And so we are a fiber provider. – Chris Winfrey, CEO Charter Communications (Morgan Stanley Technology, Media & Telecom Conference, Mar. 2025)
This evolution shapes today’s competitive landscape. US broadband providers operate across four main access technologies:
- DSL: Legacy copper-based service from providers like AT&T and Verizon – achieving 10–100 Mbps.
- Cable/HFC (Hybrid Fiber-Coax): The model used by Charter, Comcast, Altice, and others, combining a fiber backbone with coax drops – offering gigabit speeds.
- Fiber: Premium offerings by national and regional providers bringing fiber to the home (FTTH) – gigabit speeds.
- Fixed Wireless Access (FWA): A wireless broadband alternative promoted by mobile carriers such as T-Mobile, AT&T, and Verizon – 50–300 Mbps.
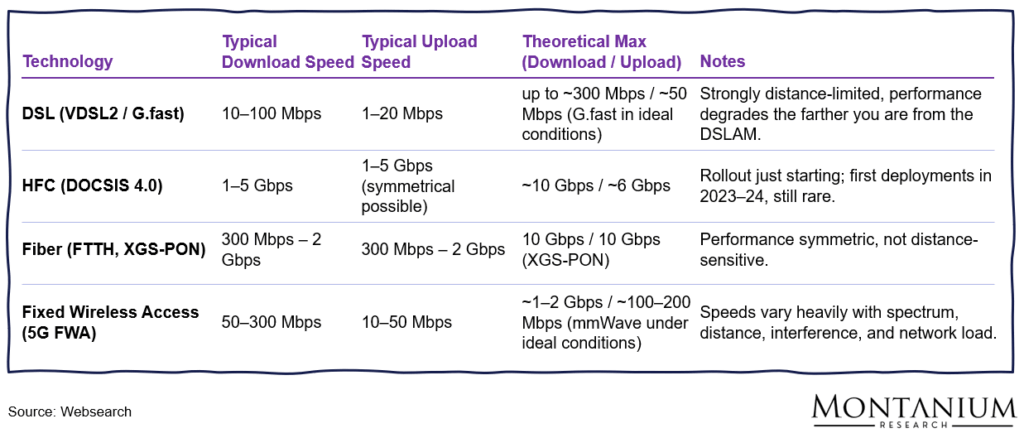
Figure 1: High-level comparison of possible download and upload speeds; Source: Websearch
For a couple of years, cable networks (HFC with DOCSIS 3.0/4.0) and fiber providers have been competing to deliver gigabit speed (1,000 Mbps), based on the assumption of rising customer demand and willingness to pay.
However, this appears to differ substantially from what most customers actually need:
- 4K video streaming, the most demanding application today, requires download speeds of only ~15–35 Mbps.
- 4K video conferencing tops upload needs at ~8–12 Mbps.
- AI users (baseline): 100–300 Mbps download and 50–100 Mbps upload – sufficient for AI assistants, 4K streaming, and multiple simultaneous users.
As the following graphic shows, even in households with multiple video streams, smart devices, and remote work setups, gigabit speeds are rarely necessary:
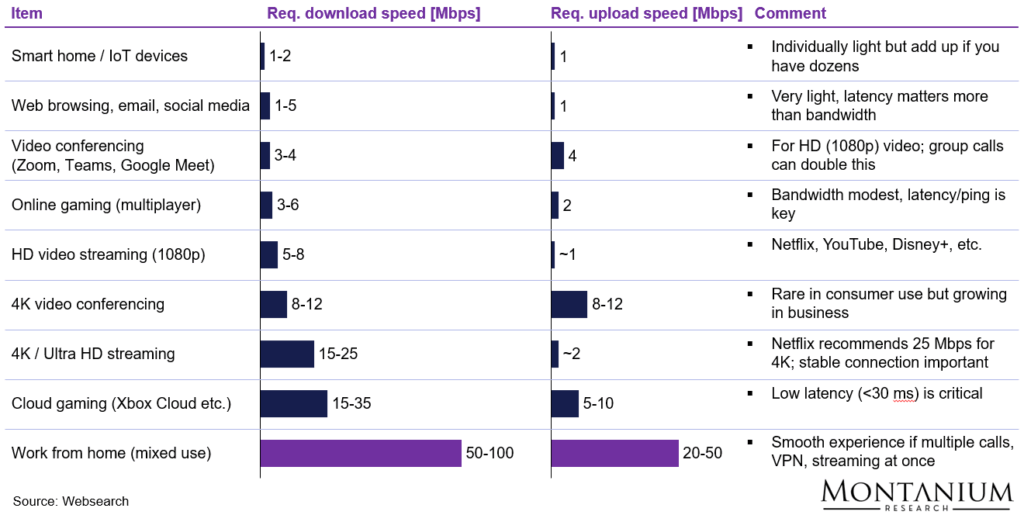
Figure 2: Download and upload speed requirements for the most critical use cases; Source: Websearch
Our conclusion: Ultimately, broadband competition is as much a cost race as it is a speed race. Providers that offer sufficient performance at the most attractive price will be best positioned to succeed, a key consideration when evaluating current threats from fiber and Fixed Wireless Access.
Another central strategic theme is the industry-wide push toward integrated broadband and mobile bundles (referred to as “convergence” in the industry). Cable operators, including Charter and Comcast, view bundling as a key lever for customer retention and pricing power.
As a result, Charter has recently started expanding more aggressively into mobile services. The company leverages its extensive Wi-Fi footprint, its CBRS 5G spectrum acquired in 2020, and its wholesale access to nationwide mobile networks—Charter has MVNO agreements in place with Verizon (renegotiated in 2019 for residential customers) and T-Mobile (signed in 2025 for business accounts with up to ~1,000 lines).
Let’s now take a closer look at the numbers, especially Charter’s current earnings power.
Current Positioning, and Earnings Power
As of Q2-2025, Charter had about 31.2 million customer relationships (individuals or entities subscribing to one or more of Charter’s services) and about 57.2 million passings, also known as “homes passed” (meaning access to another ~26 million potential customers that might become paying subscribers in the future).
One key metric that can be calculated from these figures is the so-called penetration rate:
Penetration rate = # of customer relationships / total passings = 31.2 nm / 57.2 mn = ~55%
A penetration rate of over 50% essentially indicates a mature cable operator operating in a relatively stable duopoly, i.e., primarily competing with one other DSL or fiber provider.
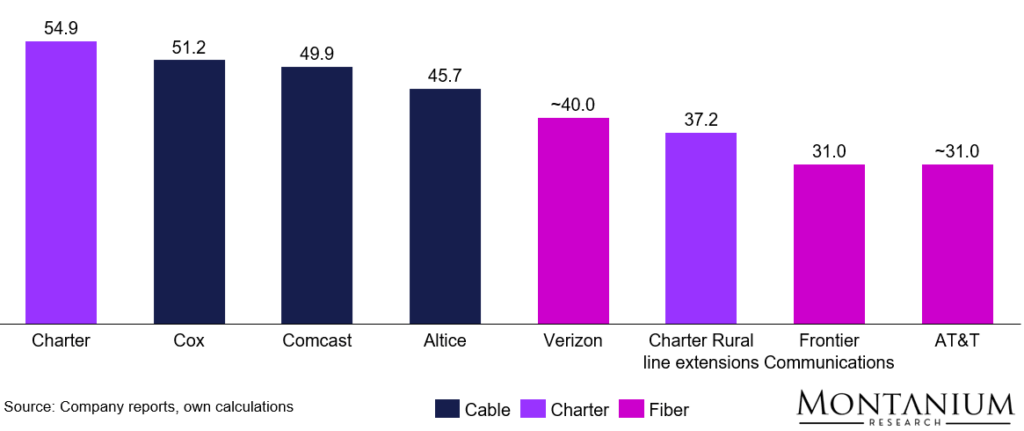
Figure 3: Penetration rate of major cable and fiber network operators; Source: Company reports, own estimates
Now, on a more granular level, those 31.2 million customer relationships correspond to the following number of individual subscriptions (residential customers only):
- Internet: 29.9 mn
- Video (linear TV bundle plus streaming bundles): 12.6 mn
- Mobile: 10.9 mn
- Voice: 6.4 mn
These over 53 million individual subscriptions generate approximately USD 42 billion in revenue annually, making up about 75% of total sales (with commercial and advertising revenue accounting for the rest).
![Breakdown of revenue 2024 Charter Communications [USD million]](https://montaniumresearch.com/wp-content/uploads/2025/09/Charter-6-1024x519.png)
Figure 4: Breakdown of revenue 2024 [USD million]; Source: Charter filings
With approximately USD 23 billion, the Broadband/Internet product is currently the largest revenue contributor, followed by Video, which generates about USD 15 billion. However, when it comes to profit margin, Video today is much less attractive.
On average, the typical residential customer pays around 123 USD/month (ARPU – Average Revenue Per User), while a business customer pays around 165 USD/month (data from Q2-2025).
![ARPU comparison by key product (Q2-2025) [USD/month/subscriber]; Charter Communications](https://montaniumresearch.com/wp-content/uploads/2025/09/Charter-7-1024x516.png)
Figure 5: ARPU comparison by key product (Q2-2025) [USD/month/subscriber]; Source: Charter Q2-25 Trending Schedule
The main operating expenses include programming at USD 9.7 billion, other cost of revenue at USD 6.4 billion, field & tech at USD 5.1 billion, customer ops at USD 3.2 billion, sales & marketing at USD 3.7 billion, and other expenses at USD 4.0 billion, leading to an EBITDA Adj. of about USD 23 billion.
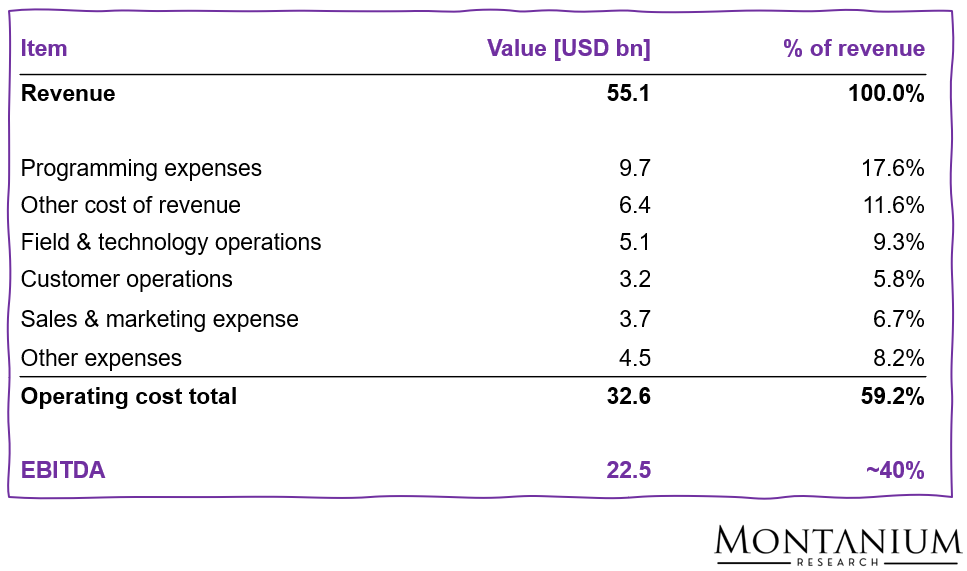
Figure 6: P&L details 2024 [USD bn, %]; Source: Charter Comm. filings
Considering annual capital expenditures of approximately USD 11 billion (see below), the company currently produces an unlevered pre-tax FCF of roughly USD 11 billion.
And just as a side note (we might discuss this further later): Without the capital spent on line extensions, meaning only considering core/network evolution CapEx, FCF would be roughly USD 4 billion higher (~USD 15 billion).
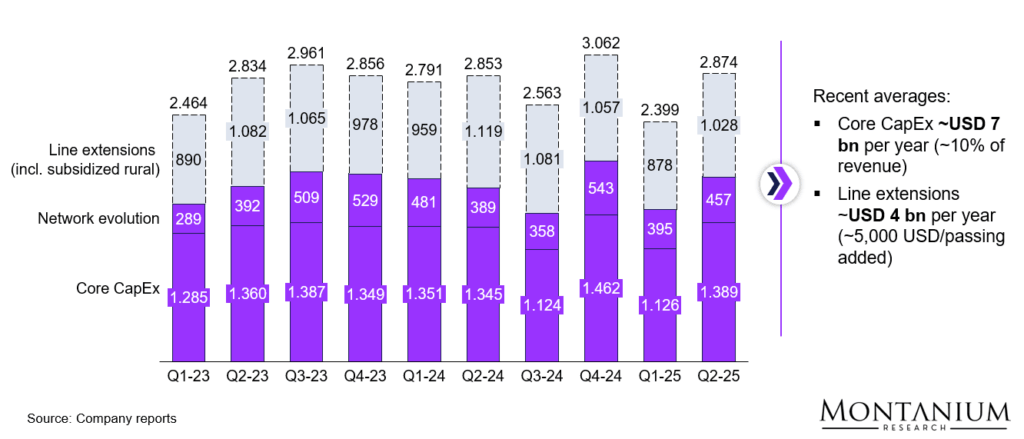
Figure 7: CapEx breakdown by quarter [USD million]; Source: Charter Comm. Q2-25 Trending Schedule
The servicing of the total financial debt, approximately USD 97 billion, results in an annual (net) interest expense of about USD 5.2 billion, with an average (net) interest rate of roughly 5.4%.

Figure 8: Development of interest expense, net debt, and implied interest rate; Source: TIKR, Charter filings
Along with other minor financial expenses, this leads to a levered pre-tax FCF of approximately USD 5.4 billion.
Considering a tax rate of 21%, levered after-tax FCF currently stands at ~USD 3.6 billion (or ~23 USD/share based on ~155 million shares outstanding on a fully diluted basis), representing a FCF yield of ~9% (or a FCF multiple of ~11x market cap).
Here’s a more detailed and precise view of Charter’s “cash P&L” for FY 2024:
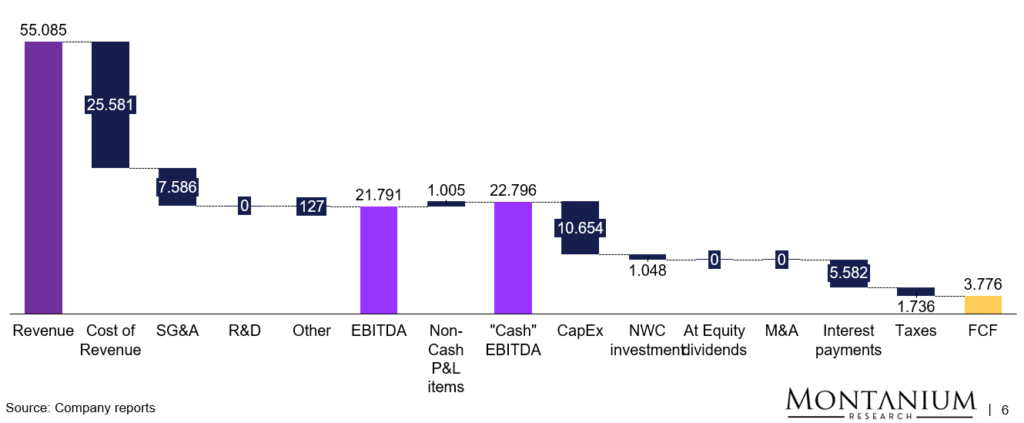
Figure 9: “Cash P&L” Charter Communications, FY 2024 [USD million]; Source: Company reports, own calculations
Analyzing the balance sheet shows that Charter is using significant leverage to enhance its return on equity (ROE). The financing section of the balance sheet indicates that most assets are debt-funded, with a leverage ratio (net debt/EBITDA) of about 4.2x.
Although the financial risk is classified as „aggressive“, the robust business model—characterized by a large share of highly stable and recurring revenues—currently supports a stable BB+ rating from Standard & Poor‘s (just below investment grade).
Side note: Following the Cox transaction, the combined company is targeting a leverage ratio of 3.5–4.0x EBITDA.
Overall, the company has approximately USD 140 billion in capital employed. On the asset side, this mainly includes Property, Plant & Equipment (such as cable infrastructure, amplifiers, etc.) and Intangible Assets (including customer relationships, contracts, and some Goodwill).
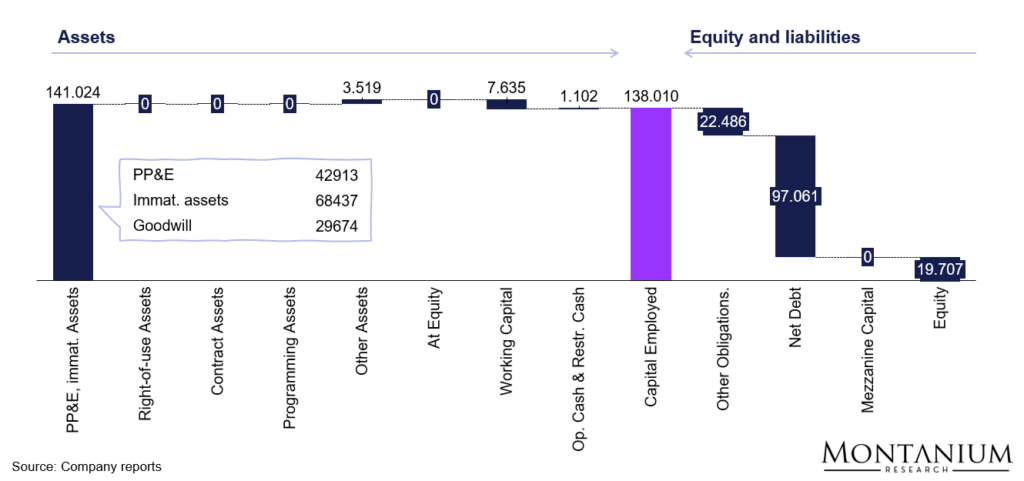
Figure 10: Breakdown of Capital Employed Charter Communications (FY 2024) [USD million]; Source: Company reports, own calculations
Using those numbers roughly provides the following returns on capital:
- Pre-tax CFROI = Unlevered pre-tax FCF / Capital Employed = USD 11 billion / USD 138 billion = 7.9%
- CFROE = Levered after-tax FCF / Total Equity = USD 3.6 billion / ~USD 19.7 billion = ~18%
Returning ~8% on total capital for an infrastructure business—from our point of view—seems to be quite attractive.
Recent Corporate Developments: “Takeover” of Liberty Broadband and Merger with Cox Communications
As mentioned earlier, Charter has historically achieved substantial growth through M&A—acquiring, among others, Time Warner Cable and Bright House in 2016.
Today, Charter again has two larger deals in the pipeline:
- It plans to acquire all outstanding shares of Liberty Broadband (LBRD) in an all-stock transaction
- It plans to acquire rival cable operator Cox Communications (CCI) for an EV of approx. USD 34.5 bn (equity value USD 21.9 bn)
Let’s examine each of the two proposed transactions in more detail, starting with Liberty Broadband.
Liberty Broadband Transaction
After Liberty Broadband recently spun off its interests in GCI Liberty to its shareholders (GCI is the largest communications provider in Alaska), the company essentially owns around 45.6 million shares of Charter common stock… and that’s it.
So the interest in Charter is Liberty’s only remaining asset!
Now, in November 2024, Charter and Liberty Broadband agreed that Charter will take over the company in an all-stock transaction based on the following simple terms:
- Each holder of Liberty Broadband common stock (Series A, B, and C) will receive0.236 shares of Charter common stock per share
- Each holder of Liberty Broadband preferred stock will receive one share of newly issued Charter cumulative redeemable preferred stock with similar terms (~USD 180 mn in total)
- Charter will make repurchases of Charter shares from Liberty Broadband in amounts of ~USD100 million per month to allow for timely repayment of Liberty debt before closing (total ~USD 2.6 billion excluding GCI’s debt)
The primary implication for Charter shareholders is that, following the transaction’s closure, ~45.6 million Charter shares will be retired, and Liberty Broadband shareholders will receive ~33.8 million newly issued Charter shares.
So, net-net, Charter’s share count will be reduced by approximately -11.5 million shares.
For these ~11.5 million shares, Charter will essentially pay ~USD 2.6 bn, which is the debt it either needs to assume at closing or allow Liberty to retire before the deadline (by purchasing some of Liberty’s Charter shares as described above).
The implied share price for this transaction thus is ~226 USD/share, which appears quite attractive—even considering the recent sell-off in Charter shares (with the stock price around 265 USD/share). These quite attractive terms can likely be attributed to the ongoing trading discount Liberty Broadband has been experiencing compared to its major holding.
Cox Communications Transaction
Compared to the Liberty Broadband transaction, the merger with Cox Communications will also have significant operational implications.
Before we look into the pro-forma financials of the combined entity, here is a short overview of the deal:
- Cox Enterprises will contribute Cox Communications (~12 million passings and 6 million subscribers) to Charter’s existing partnership structure
- Cox Enterprises will own ~23% of the combined company’s common shares, on an as-converted, as-exchanged basis
- The transaction values Cox Communications at ~USD 34.5 bn (EV) based on 6.44x 2025E Adj. EBITDA (<6.0x incl. cost synergies):
- USD 21.9 bn of equity
- USD 12.6 bn of net debt and other obligations
- Cox Enterprises will thus receive USD 21.9 bn of consideration:
- USD 11.9 bn Charter partnership common units, exchangeable into Charter Series A common stock
- USD 6.0 bn notional value Charter partnership convertible preferred units
- USD 4.0 bn cash
- The parties expect to capture ~USD 500 million in cost synergies (ramp-up completed after three years post-closing)
- Closing of the transaction is anticipated by mid-2026
After closing, the corporate structure is expected to look something like this, with the Cox holding company (Cox Enterprises) owning ~23% of the combined entity:
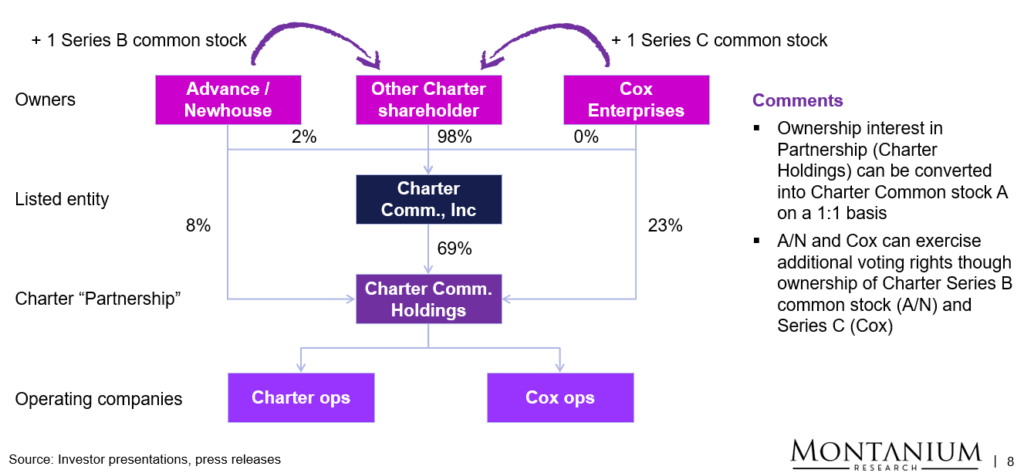
Figure 11: Charter ownership structure post-closing of the COX transaction; Source: Investor presentation
What at first sight seems to be a bit difficult to understand is the following: Cox Communications (the operating company) will be owned by Charter Communications Holdings, the so-called „Charter Partnership“ (if we understand it correctly). Cox Enterprises initially will receive three things:
- an ownership interest of 23% in the partnership (i.e., the holding company) – whereby each share of partnership interest can be converted into one share of Charter Series A common stock (at any time)
- One share of newly created Series C common stock of the listed entity that holds all the relevant voting rights
- USD 6 bn worth of convertible preferred stock that – if held – pays an annual cash dividend of ~USD 413 million (coupon of ~6.875%). The preferred stock can be converted into Charter Series A common stock at a 35% premium
On an operational level, the combined company is expected to own approximately 70 million passings and have ~38 million subscribers. Here is an overview of the key pro-forma subscriber numbers:
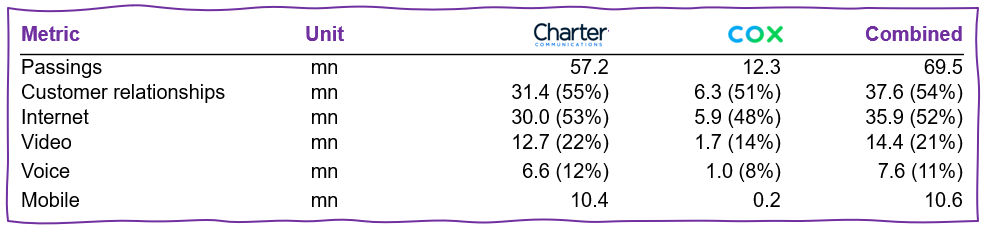
Figure 12: Pro-forma subscriber numbers of the combined Charter Cox company
Based on the numbers, it seems that—beyond the expected USD 500 million in cost synergies—the merger also offers significant improvement potential on the commercial side, particularly related to mobile subscriptions and launching the new video streaming bundles to Cox subscribers:
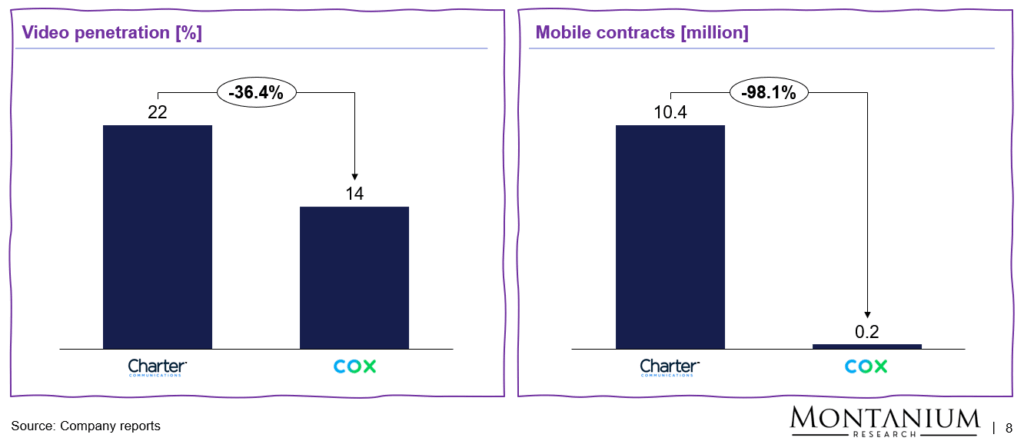
Figure 13: Opportunities in Video penetration and Mobile contracts; Source: Investor presentations
What’s even more interesting than the commercial KPIs are the pro-forma financials of the new company.
Here’s our high-level estimate of FCF per share (excluding any sales-related synergies and assuming 100% conversion of preferred stock):
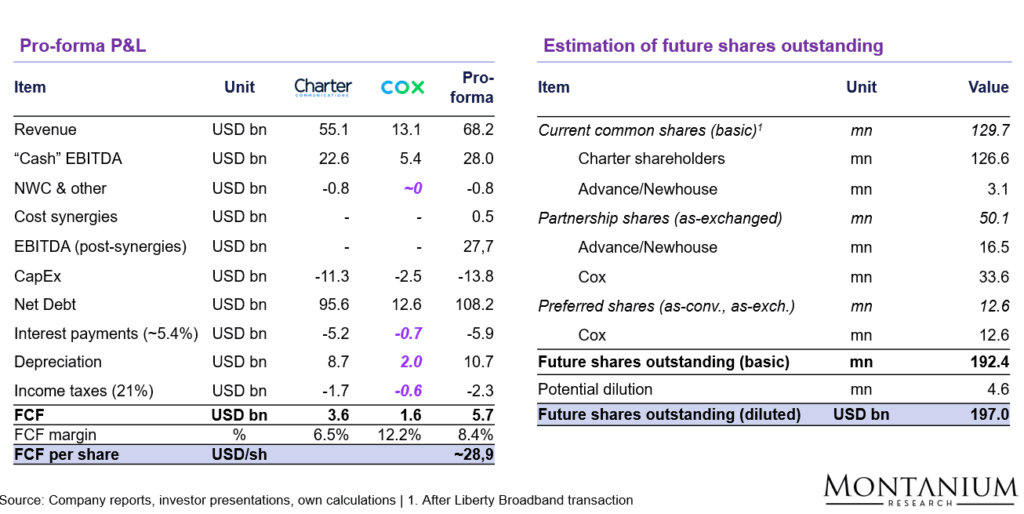
Figure 14: FCF calculation for combined Charter Cox entity; Source: Investor presentation, own estimates (numbers in pink are estimates)
Overall, including the capture of cost synergies (but not commercial synergies), FCF per share could grow to approximately 29 USD/share, from the stand-alone value for Charter of ~23 USD/share—calculation see above. Based on the current share price, this would be equivalent to a FCF yield of ~11% (or 9x FCF).
Current Operational Themes: Sustained Broadband and Video Subscriber Losses, Growth in Mobile
Having discussed the main structural developments, we’re now going to highlight the key operational themes.
On the one hand, Charter is still losing subscribers in its existing broadband, video, and voice businesses. On the other hand, it is growing its customer base in mobile, expanding into rural areas, and expanding ARPU (Average Revenue per User) consistently.
Subscriber Losses in Broadband and Video
Operationally, the company is currently facing challenges on several fronts:
- The ongoing shift toward streaming continues to drive declines in traditional video subscriptions.
- Increasing competition from fiber overbuilds and Fixed Wireless Access (FWA) is eroding Charter’s broadband business, which has become the company’s most essential product segment.
Here are some recent figures to support the narrative:
![Figure 15: Net adds Charter by business and quarter [Thsd. subscribers]; Source: Company reports](https://montaniumresearch.com/wp-content/uploads/2025/09/Charter-17-1024x492.png)
Figure 15: Net adds Charter by business and quarter [Thsd. subscribers]; Source: Company reports
Naturally, the net losses in the main product categories also caused a decline in overall customer relationships over the past few quarters. Since Q-2023, customer relationships declined by approximately 1 million subscribers or 3.2%, reaching about 31.2 million relationships by the end of June 2025.
Focusing solely on residential customers, the net change in individual subscriber adds (or losses) collectively impacted the overall subscriber count as follows:
![Figure 16: Charter Communications - Development of residential subscriber numbers by key product [millions]](https://montaniumresearch.com/wp-content/uploads/2025/09/Charter-18-1024x412.png)
Figure 16: Development of residential subscriber numbers by key product [millions]; Source: Company reporting
Given the ongoing secular decline trend, the investing community has generally expected subscriber losses in Video and Voice.
With the end of the ACP program, which subsidized broadband access for low-income families, a certain churn among broadband subscribers was also anticipated.
However, it appears that the average market participant was caught off guard by the rising broadband customer losses in the second quarter, particularly given CEO Chris Winfrey’s earlier assurance that the elevated churn following the end of the ACP program had already subsided.
And you put that all together [the investments] and having ACP now fully behind us, hopefully, a little bit of lightening of the competitive environment sets us up for growth. – Charter CEO Chris Winfrey at the Morgan Stanley Technology, Media & Telecom Conference, Mar. 2025
Quite naturally, the market attributed the rising broadband subscriber losses to an increasing competitive threat from fiber and FWA providers like T-Mobile, Verizon, and AT&T.
Gains in Mobile and Rural Footprint
But there are also a couple of positive developments:
- Charter is still growing its mobile subscriber base by ~500k customers per quarter (as can be seen in the graphic above)
- Charter is also organically growing homes passed via its subsidized rural expansion initiative (so far, ~1 million passings have been added since the program started in 2022)
- Charter has managed to increase ARPU pretty much consistently (to a large extent, resulting from the continued investment into the network and from bundling efforts)
![Figure 17: ARPU development from Q1-23 to Q2-25 [USD/month/subscriber]; Source: Charter Comm. Q2-25 Trending Schedule](https://montaniumresearch.com/wp-content/uploads/2025/09/Charter-19-1024x411.png)
Figure 17: ARPU development from Q1-23 to Q2-25 [USD/month/subscriber]; Source: Charter Comm. Q2-25 Trending Schedule
All in all, video and broadband subscriber churn on the one hand, and mobile and rural growth, as well as price increases, on the other, basically level out: Revenue and EBITDA have both remained relatively stable… so far:
![Figure 18: Residential revenue by key product [USD mn]; Source: Company reports](https://montaniumresearch.com/wp-content/uploads/2025/09/Charter-20.png)
Figure 18: Residential revenue by key product [USD mn]; Source: Company reports
So what’s the key takeaway from these recent operational developments?
How does the Market Interpret what’s happening at Charter?
As is often the case, the market appears to be focusing on the short-term in its assessment, placing significant weight on the recent—and partly unexpected—broadband subscriber losses. At present, investor sentiment reflects heightened concern that the threat from FWA is substantially greater than previously assumed.
Following the release of the latest quarterly report, Charter’s share price declined by roughly 15% to around 260 USD/share, representing a drop of nearly 70% from its 2021 peak:
![Figure 19: Share price development CHTR [USD/share]; Source: Refinitiv](https://montaniumresearch.com/wp-content/uploads/2025/09/Charter-21-1024x468.png)
Figure 19: Share price development CHTR [USD/share]; Source: Refinitiv
At this level, Charter is trading at approximately 10–11x FCF, implying a FCF yield of around 9–10%. This is relatively low, even before factoring in potential future upside to free cash flow.
From a valuation perspective, Charter’s EV/EBITDA multiple has reached a 10-year low:
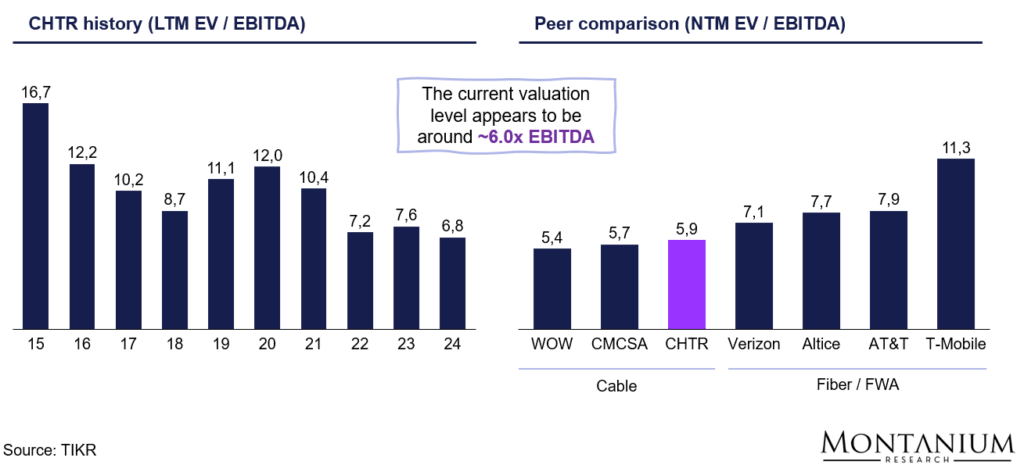
Figure 20: EV/EBITDA comparison CHTR versus own history and peers; Source: TIKR
The peer group comparison highlights that most cable operators currently trade at a discount relative to fiber and FWA-focused providers. (Note: Altice offers a hybrid mix of both cable and fiber products.)
This raises the key question: Why do we believe that the market’s current view is overly pessimistic and that Charter’s fundamentals will develop far more favorably than reflected in its current stock price?
Investment Thesis
We believe that the market has been overreacting based on short-term information and that the current valuation is not reflecting the long-term fundamentals for the following reasons:
- Fiber and FWA threat likely overstated: Competitive pressures from fiber overbuilds and Fixed Wireless Access (FWA) appear less severe than market sentiment suggests.
- Mobile growth potential: Charter still has significant runway in mobile, with subscriber growth expected to contribute positively to earnings. The T-Mobile MVNO agreement has also strengthened Charter’s and Comcast’s bargaining position ahead of Verizon contract renegotiations in early 2026.
- Rural expansion: An additional ~500,000–600,000 profitable passings are expected to be added in the coming months.
- Video business stabilization: The video segment is likely to stabilize as a result of the new bundling strategy, providing additional subscriber stickiness to the overall system.
- Sustained ARPU growth: Continued ARPU growth of approximately 2% annually appears achievable.
- CapEx reductions: Capital expenditures are projected to decline by roughly USD 4–5 billion per year starting in 2027, with potential for an additional USD 1 billion in savings if Cox’s optimization initiatives are incorporated.
- Share repurchases: Buybacks could total approximately 4–13 million shares annually, equivalent to 20–65 million shares over our five-year horizon.
Next, we will review each item individually.
Challenge #1: Competition through Fiber Optics
The economics of fiber overbuild largely depend on the competitive situation (zero, one, or two competitors) and the type of market (dense urban, suburban, rural, etc.).
In any case, the share of fiber overbuild has been gradually increasing for years without having any meaningful negative impact on Charter (currently standing at ~55-60% of Charter’s footprint).
![Figure 21: Share of Charter's network already overbuilt with fiber [%]; Source: Company reports, 33rd DB Media, Internet & Telecom Conference transcript (Quartr)](https://montaniumresearch.com/wp-content/uploads/2025/09/Charter-23-1024x462.png)
Figure 21: Share of Charter’s network already overbuilt with fiber [%]; Source: Company reports, 33rd DB Media, Internet & Telecom Conference transcript (Quartr)
The main reasons for Charter’s strong competitive position are:
- A depreciated legacy network that can be (and currently is) upgraded to gigabit speeds at very low cost (roughly ~100–300 USD/passing) while fiber build-outs, on the other hand, are pretty expensive (~1,000–2,500 USD/passing for suburban areas). This gives Charter some pricing leverage versus the competition
- In the majority of cases, a stable duopoly situation that allows Charter to maintain attractive ARPU levels
- High “stickiness” of subscribers due to attractive bundle offers (broadband + video + mobile)
- (Modest) switching barriers: Switching involves doing research, reading contract terms, installation hassles, etc.
- Charter’s own footprint consists of more than 90% fiber assets. So if worst comes to worst, Charter could itself offer an FTTH product to its customers in most areas
Furthermore, one of the main benefits of fiber – equally high download and upload speeds – is essentially irrelevant for most retail customers and use cases (see above).
If we now step back and consider fiber overbuild from a business case perspective, we can identify three potential scenarios for a new fiber startup (or the fiber operations of a legacy DSL competitor).
- Build in rural areas without any existing footprint: Obviously, this doesn’t hurt Charter but rather presents an opportunity to build a subsidized footprint there itself — see Charter’s rural build initiative.
- Replace DSL in an existing duopoly: This doesn’t significantly alter the competitive landscape, as Charter can upgrade its network to fiber-like speeds at very low cost. If needed, Charter can compete on price.
- Enter an existing duopoly as the third incumbent: This is likely not reaching the hurdle rate for the final investment decision (FID), and therefore (if managers and investors act rationally) shouldn’t represent a threat to Charter either
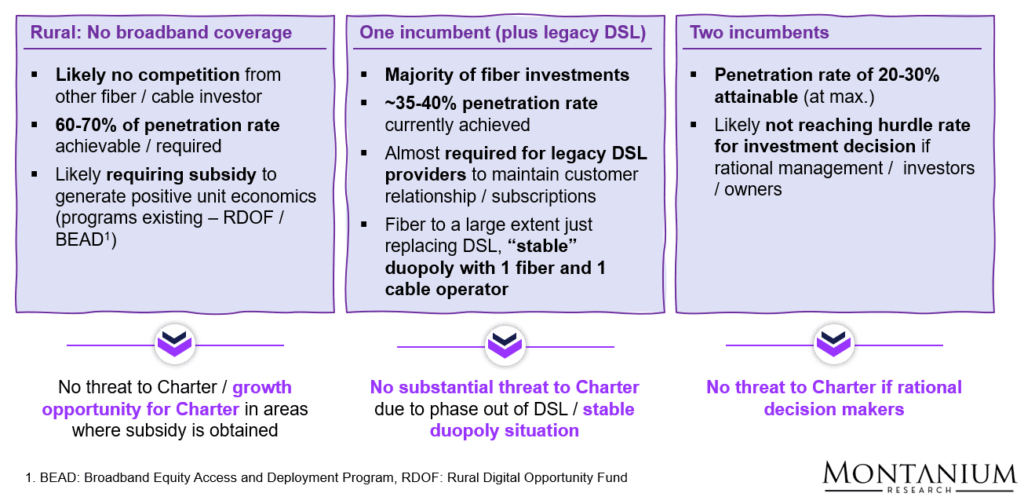
Figure 22: Potential options for fiber build in the US
It is worth taking a closer look at the third competitive threat: Why is entering a cable or fiber market with two established incumbents usually considered to be a poor business decision, and more generally, a bad idea?
Let’s review the steady-state economics of such a scenario. Here, “steady state” refers to a discrete future year, assuming the following conditions:
- Market share/penetration rate stabilizes at ~20% (achievable only with highly aggressive pricing).
- Broadband-only ARPU of ~60 USD/month per subscriber (low due to intense competition).
- SG&A at ~15% of revenue, reflecting fixed-cost leverage across an extensive network (realistically achievable only by scale players like Verizon or AT&T).
- Optimized maintenance CapEx of ~8% of revenue, consistent with aging infrastructure.
- Initial investment fully depreciated, with no remaining tax shield.
Based on these assumptions, the business case delivers an unlevered pre-tax ROI of only ~4%. This result, although highly sensitive to ARPU and CapEx assumptions, illustrates quite nicely why third-fiber entrants struggle to earn attractive returns:
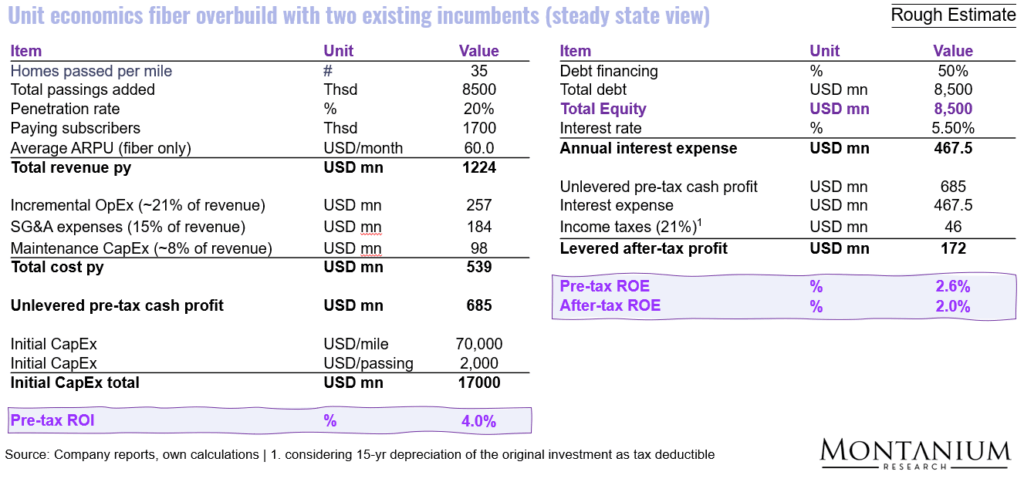
Figure 23: High-level ROI calculation for fiber overbuild as third incumbent (steady state)
A statement by Michael Katz, President of Marketing, Strategy & Product at T-Mobile USA, emphasizes that fiber growth is unlikely to occur in markets with two incumbents already present.
And there’s still a lot of places left to cover this country where you can be first to market fiber. – Michael Katz
So… while fiber is arguably growing as a competitive threat, especially in well-served metro areas, the majority of Charter’s broadband subscriber churn currently seems to be shifting towards fixed wireless providers or simply leaving the market (due to ACP expiration or other economic reasons), rather than jumping to fiber… which is also illustrated by the broadband net adds over the past years:
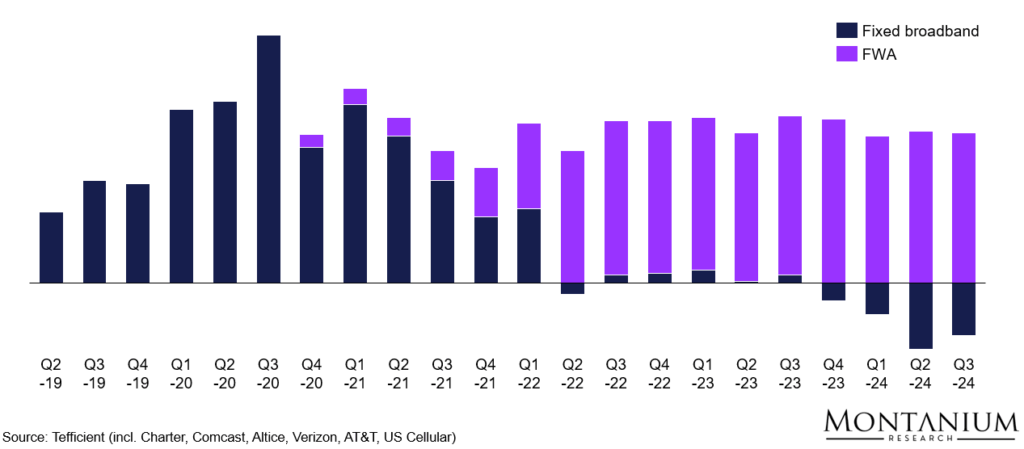
Figure 24: Broadband net adds by quarter; Source: Tefficient; Note: Fixed broadband data incl. Charter, Comcast, Altice, Verizon, AT&T, US Cellular
Challenge #2: Competition from Fixed Wireless Access (FWA)
In comparison to fiber overbuilds, Fixed Wireless Access (FWA) represents a quite distinct competitive threat.
Just to recap: Fixed Wireless Access (FWA) is a type of high-speed internet service that delivers connectivity to homes or businesses via wireless signals from nearby cell towers, rather than through physical cables like fiber or coax.
Mobile network operators (MNOs) such as T-Mobile, Verizon, and AT&T have started offering this type of internet in 2021 for as low as ~35 USD/month. That’s why it has received quite some attention and is particularly appealing to price-sensitive customers without the need for gigabit speeds.
The big advantage for operators: FWA can be deployed quickly using existing macro sites/cell towers along with existing spectrum, allowing mobile operators to monetize unused capacity at a very low marginal cost.
Spectrum Capacity and Limitations
The flip side of the coin, however, is that spectrum is a limited resource: The number of FWA subscribers an MNO can serve depends on several factors… the amount of spectrum it owns, the areas’ population density, the amount of data each user consumes, and finally, also on the number of mobile subscribers already on the same spectrum.
So let’s break it down a bit further.
In general, only mid-band spectrum (~1–6 GHz, such as 2.5 GHz and 3.5 GHz) provides the right balance of range and speed for FWA (lower frequencies cover larger areas but support less data; higher frequencies carry more data but only cover smaller areas).
For example, T-Mobile owns approximately 150 MHz of 2.5 GHz mid-band spectrum (nationwide) and may aggregate an additional 20 MHz from low-band spectrum.
T-Mobile’s approach essentially segments the US into ~165m hexbins (smaller in densely populated areas) and prioritizes deployment based on mobile usage and growth potential. Areas with the highest-value mobile customers are served first, and fixed wireless access (FWA) is only offered in hexbins with sufficient excess network capacity.
And it’s logical: Since FWA users consume significantly more data than mobile users (~400–700 GB/month vs. ~50 GB/month), MNOs prioritize mobile subscribers, offering FWA only when spare capacity is available. Market commentary usually suggests that—depending on the area—~20–40% of capacity could be available for FWA subscribers.
We protect the mobile base and the mobile connectivity base at all costs. – Peter Osvaldik, CFO T-Mobile US
Based on these limitations, FWA providers have to date acquired about 14 million broadband customers. By the end of this decade, they aim to raise this number to almost 30 million:
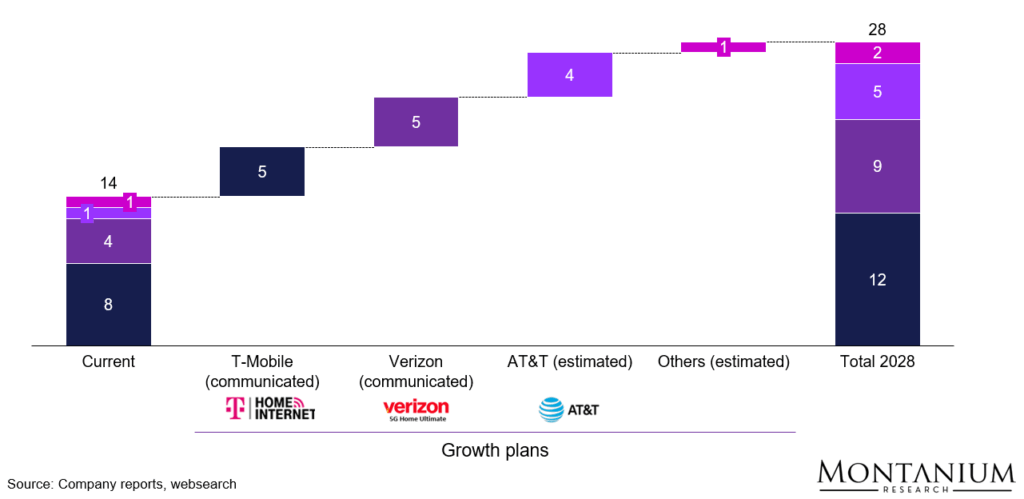
Figure 25: FWA targets by operator; Source: Company reports, websearch
So, back to our main question: Is this growth actually posing a real threat to cable operators like Charter or Comcast?
We believe that in the longer-term, the threat from FWA should be quite limited.
Short- to Mid-term Market Impact
First, it’s essential to acknowledge one key point: The US broadband market is still expected to grow modestly over the next couple of years.
We believe that we could see the market growing from ~132 million subscriptions today (OECD data) to ~147 million by 2030 (~1.8% annual growth), based on the following logic:
- Household growth: Approximately 0.85 million per year, leading to about 138 million households by 2030.
- Broadband penetration: Increasing to ~95–97% (from ~92% today)
- Average broadband subscriptions per household: Stable at ~1.1 (accounting for backup, business, and multi-dwelling units)
Here’s the math:
Broadband subscriptions 2030 = No. of households x household penetration x subscriptions per household = 138 mn x 97% x 1.1 = ~147 mn broadband subscriptions
Targeted FWA growth (~2–3 million net additions annually) can therefore mostly be absorbed through market expansion.
Bottom line: For cable operators like Charter, the potential impact of current FWA growth is likely to be relatively minor. However, opportunities for organic growth are likely to be quite limited as well.
And what about the long-term?
Long-term Development of FWA
Regarding the longer-term development of fixed wireless, there seem to be two narratives:
- Dedicated investments into new spectrum or towers aimed at utilizing additional capacity for FWA are not envisioned
- FWA might, in the medium-term, be replaced by fiber offerings in certain areas
Dedicated FWA investments: In a recent interview, T-Mobile’s CTO emphasized that further FWA growth will most likely rely on squeezing more efficiency out of existing towers and spectrum (rather than investing in new spectrum licenses or towers).
So the way I think of it our center of gravity is very much the fallow capacity model. Now, we’re looking at whether other models work or not. But one of the reasons that’s our center of gravity, one myth is that to some extent, mobile technology is static. The reality is, with each passing day, especially with our 5G SA network, we’re finding more and more opportunities to squeeze more out of our existing spectrum, out of our existing towers. Now, there’s a lot of work still to be done, but we’re consistently challenging our 12 million target and looking at how much more we can squeeze from our network in terms of fallow capacity. – Srinivasan Gopalan, COO T-Mobile USA (Q2-25 earnings call)
Potential replacement of FWA by fiber: In many instances and markets, operators seem to view fixed wireless as a transitional technology. The latest MNO to voice this opinion was AT&T in its press release related to the takeover of spectrum licenses from Echostar in August 2025:
As a result of this transaction, AT&T expects to accelerate and expand availability of its advanced fixed wireless home internet service – AT&T Internet Air. This includes areas where the Company intends to offer AT&T Fiber in the future. By rapidly deploying these mid-band spectrum licenses, the Company has the ability to quickly grow its base of AT&T Internet Air customers in these areas and migrate them to AT&T Fiber over time. – Press release AT&T, Aug. 26, 2025
What this excerpt basically says is that although AT&T plans to use newly acquired mid-band spectrum to rapidly expand its FWA offering in the short-term, its long-term intention is to migrate those customers over to fiber (once in place).
So, to summarize: FWA offers a cost-effective incremental broadband option by utilizing unused spectrum and existing towers without requiring major capital investment.
Current growth is limited by spectrum availability, tower access, and higher data demand compared to mobile users.
While this presents a modest competitive threat to cable operators, most of the market growth will be absorbed by existing services. Dedicated investments in new spectrum or towers seem unlikely in the near future. On the contrary, industry commentary suggests that at least some FWA customers will eventually be migrated (back) to fiber.
In any case, to be on the conservative side in our valuation, we projected a net loss of approximately 2.5 million broadband subscribers through 2030 in our base case scenario.
Opportunity #1: Growth in Rural Areas
Charter’s rural expansion initiative is continuing at full speed. Since Q1-23, the company has spent ~USD 4.5 billion to add ~850,000 passings, which equates to an expansion cost of around USD 5,000 per passing. In total, the company plans to add 1.6–1.7 million passings as part of the initiative.
At first glance, this investment appears relatively high compared to a typical fiber project, which usually costs around 1,500 to 2,500 USD/passing. The primary reason for this is that rural areas typically have a substantially lower population density (i.e., a lower number of passings per mile).
During a teleconference in Dec. 24, CEO Chris Winfrey noted that Charter is currently constructing fiber at approximately 10 homes per mile.
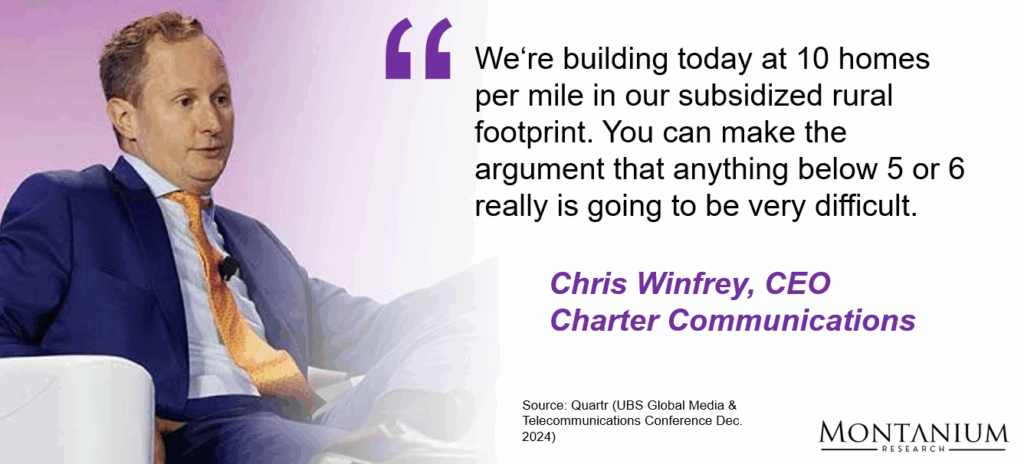
Figure 26: Charter CEo Chris Winfrey on the rural expansion inititive; Source: Quartr
Still, the rural expansion can probably be considered an attractive investment for two main reasons:
- Due to limited competition, the take rate can potentially be as high as 70-75% (versus the 40-50% we usually see in a stable duopoly situation).
- The expansion of cable/fiber into rural areas is typically subsidized. As part of the rural expansion initiative, Charter plans to invest ~USD 8 billion in total, out of which ~USD 2 billion should be funded by the state or regional governments.
Note: Because the subsidies are paid out over a period of ~10 years, Charter discloses them as part of the revenue line (“subsidy revenue”). In practice, however, the subsidies represent a type of CapEx funding. Even though the subsidies are paid out over a multi-year period, the economic intent is to make the upfront investment viable.
In the economic assessment of the rural expansion initiative, we therefore treated the subsidy as a 25% CapEx reduction.
Here’s an overview of the main assumptions:
- Total passings added: 1.7 million
- LT penetration rate: 70%
- ARPU (excl. subsidy revenue): ~120 USD/month (all products, no future growth assumed)
- CapEx: ~5,000 USD/passing (includes investment for the drop of already connected customers)
- Subsidy: ~25% of CapEx
- Operating margin (EBITDA equivalent): Similar to Charter’s overall business, i.e., ~40% although there might be some additional economies of scale
- Maintenance CapEx: ~8% of revenue
- Financing: 80% debt at ~5.5% interest rate
Now, when we do the calculation for a steady-state scenario based on the above assumptions, we find that the business case (on an ROE basis, considering 80% debt financing) looks quite attractive. Overall, the rural growth initiative – from an EBITDA margin and ROI perspective – shouldn’t perform a lot differently from the overall company.
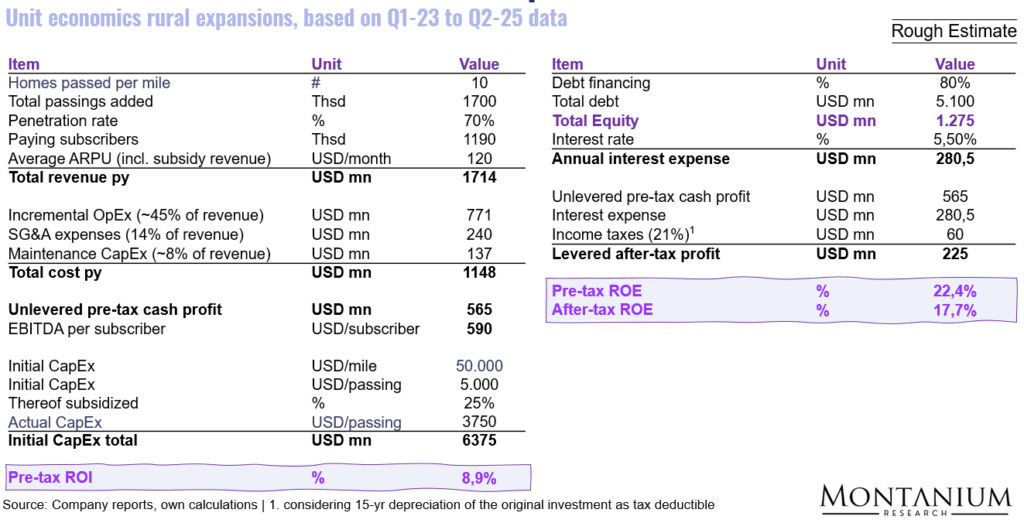
Figure 27: An estimate of rural expansion economics
Over the next 1-2 years, we can probably expect an addition of approximately 600,000 rural passings based on this initiative. If we assume a ramp-up of penetration rate (for each cohort) over a couple of years, as displayed below, the amount of additional subscribers by the end of this decade (~5 years from now) could reach ~1.2 million, contributing ~USD 550 million of unlevered pre-tax cash profit to Charter’s bottom line.
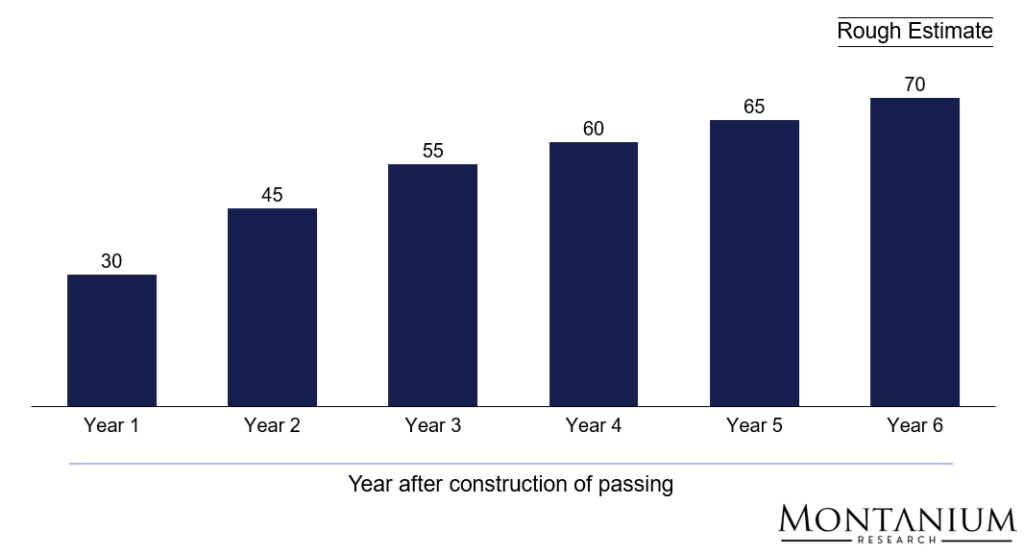
Figure 28: Estimated ramp-up of rural penetration rate for each cohort
Opportunity #2: Growth in Mobile
Charter could be named a mobile operator for a couple of years now.
Their original MVNO deal with Verizon dates back to 2012, when Charter, Comcast, and other cable companies sold their AWS wireless spectrum to Verizon for ~USD 3.9 billion.
Since then, Charter has renegotiated the Verizon contract in 2019 and made multiple tweaks to its mobile strategy. As a consequence, subscriber numbers have increased steadily in recent years and have recently reached ~11 million subscribers:
![Figure 29: Development of Charters mobile subscribers by quarter [million customers]; Source: Charter Comm. trending schedules](https://montaniumresearch.com/wp-content/uploads/2025/09/Charter-31-1024x453.png)
Figure 29: Development of Charters mobile subscribers by quarter [million customers]; Source: Charter Comm. trending schedules
Although that’s not a lot compared to the large MNOs (see following graphic), Charter has developed the mobile business into a sizeable operation, making it the second largest MVNO in the US:
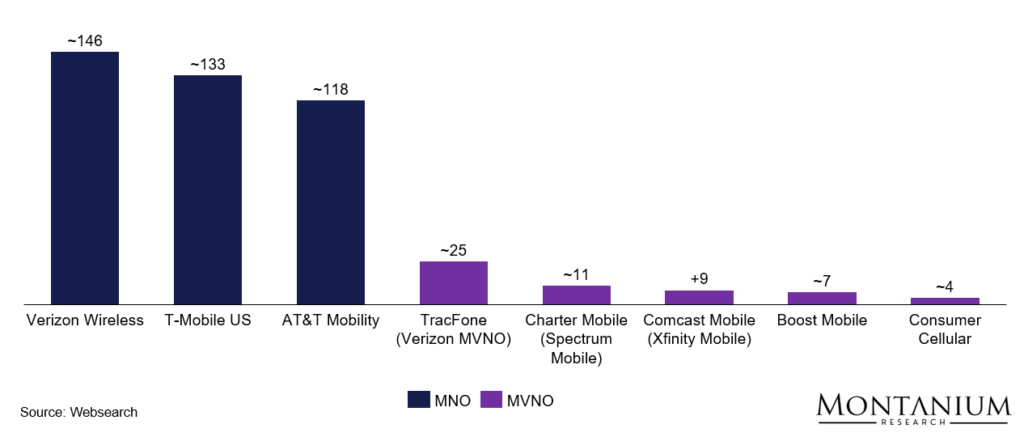
As of Q2 2025, Charter has approximately 11 million mobile subscribers, resulting in a penetration rate of less than 20% of available passings, compared to about 55% for the broadband service.
Now, although it’s pretty challenging to quantify the unit economics, there are several reasons to believe that Charter’s mobile business could eventually become a sizeable and profitable business for the company:
- Clever marketing of bundled offers might lead to continued subscriber growth
- The “convergence” of mobile and fixed broadband offerings might lead to an improved stickiness of customers, i.e., lower churn and therefore improved sales & marketing costs overall
- MVNO fees might improve going forward due to upcoming contract negotiations
- Additional data offloading onto “captive” Wifi and small cell radios might reduce MVNO fees further
- The mobile business is benefitting from economies of scale on the SG&A side (due to being part of a large, scaled organization)
- It’s a CapEx-light business model, basically only requiring ~120 USD of investment per net add (relatively stable over the past couple of years)
Verizon MVNO deal: According to industry sources, the MVNO deal with Verizon is set to expire in 2026. Based on recent market dynamics, it seems likely that Charter will be able to negotiate improved terms:
- For Verizon, the MVNO deal represents a substantial cash flow contribution (reportedly ~USD 1.9 billion annually) – so the deal is quite crucial for Verizon
- T-Mobile recently emerged as a potential MVNO partner for Charter and Comcast (due to the MVNO deal for smaller business customers), which puts additional pressure on Verizon to offer improved contract terms
Offloading: Charter is already offloading ~85% of its mobile traffic via its fiber/HFC network (compared to 0-40% for T-Mobile and ~70% for Verizon). Charter believes that another ~5% offloading should be possible by leveraging its CBRS mobile licenses:
Tom Rutledge, our previous CEO, had once said that when we were at 85% offload, he said that 1/3 of the remaining could be offloaded through particularly CBRS. Now we’ve moved up on that just because of a better Wi-fi attach. – Chris Winfrey, CEO Charter, at MoffattNathanson 2025 Media, Internet & Communications Conference
More generally speaking, given the capacity and speed advantages of fiber versus mobile data transfers, the convergence of mobile and fixed broadband offers should ultimately benefit those players with an existing fiber optics/HFC network (and the corresponding “offloading” capabilities).
Potential Economics of the Business
If we look at the key KPIs and the resulting estimated cash P&L, we find the following:
Mobile ARPU has been relatively stable over the past couple of quarters at around ~28-30 USD/sub/month (which includes free promotions at the beginning of the subscription period).
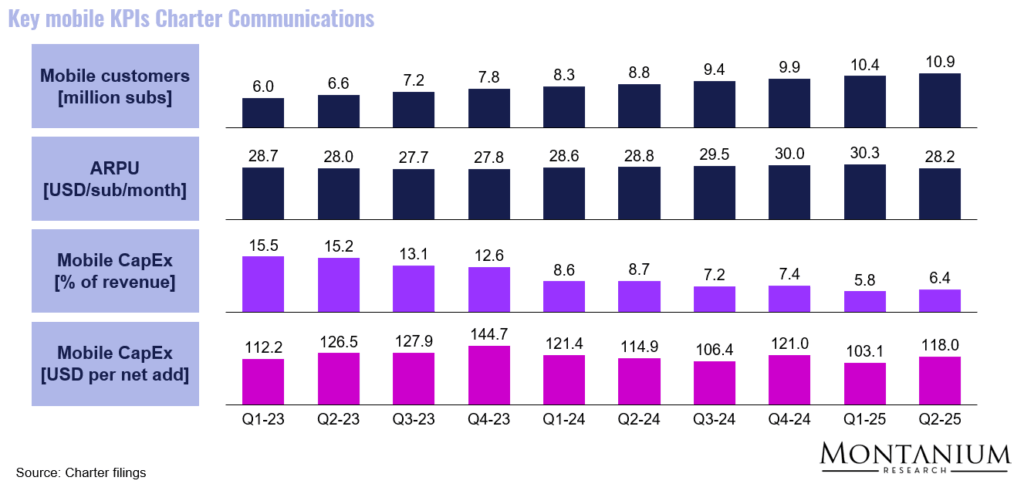
Figure 30: Key mobile KPIs Charter Communications; Source: Charter Comm. filings
The wholesale cost paid to Verizon currently should be around 10-14 USD/subscriber.
If we take Verizon’s reported cash inflow of USD 1.9 billion and divide it by the current number of Charter mobile subscribers, we get to ~USD 14/sub/month.
If we use 2.5 USD/GB (another reported number), multiply it by the average data volume per subscriber (~30 GB/month max for the 30 USD package), and assume an offloading factor of 87% (based on Charter’s own information), we end up at a monthly wholesale cost per subscriber of ~10 USD.
Now, if we further assume offloading another ~5% of data volume onto the captive Wifi and CBRS networks, respectively, the wholesale cost could decrease to ~7.5 USD/sub:
Wholesale cost = 2.5 USD/GB x 30 GB x (1 – 90% offload) = ~7.5 USD
All this could lead to a margin over variable cost (or something close to that) of up to 75%.
If we then subtract all other cost of revenue, tech support, customer service (~27% based on Charter’s overall financials), admin cost (~9%), and some maintenance CapEx / expenses (max. 5-6%), we end up at an operating margin before marketing cost/customer acquisition cost (CAC) of up to ~33%.
Now, a typical monthly churn rate is reported to be in the range of ~1.1% to 1.3%, resulting in an average customer lifetime of ~6.9 years or 83 months (~100% / 1.2%). However, given the product bundling Charter can utilize, monthly churn might—over the long-term—even reduce to below 1.0% (increasing customer lifetime to >8 years or ~100 months).
That basically means that – undiscounted – Charter could at some point earn up to ~USD 990 in total with each customer:
CLTV (undiscounted) = 100 months x 30 USD/month x 33% margin = ~990 USD
Discounted at an annual rate of 10%, the number would decrease to ~680 USD per customer, which is the capital available to spend upfront for marketing and customer acquisition.
Although this represents a quite optimistic (and also high-level) scenario, it nevertheless indicates that over the long-term, the mobile business could—standalone—be accretive to the bottom-line.
In any case, for our valuation, we basically assumed cash flow neutrality for the next couple of years.
Opportunity #3: Reduced Video Churn
A few years ago, Charter had reached a point where video was seen as a potential liability rather than an asset in the broadband customer relationship.
This shift was driven by rising programming fees, limited flexibility to create attractive TV packages, and growing competition from programmers themselves, who were offering direct-to-consumer (DTC) packages at lower prices, with fewer ads and larger on-demand libraries.
These dynamics made it increasingly difficult for Charter to compete effectively in the video market.
We said we’re either going to be in the business or we’re not. And we’re going to either have something that we’re really proud of to put on the bill of a broadband customer, or we will be out of the business. – CEO Chris Winfrey
As a result, over the past couple of years, Charter has taken significant steps to turn around (i.e., stabilize) the video business by entering into bilateral agreements to include the relevant streaming services into Charter’s video bundle (Disney+, Paramount+, HBO Max, Peacock…).
Overall, Charter managed to include an additional approximately USD 80 in value in its Spectrum Select package. Note: Netflix and Amazon Prime, currently not included in the bundle, are still available to watch via the Xumo Stream Box.
At USD 115 per month, the offer includes all the relevant legacy TV channels (including news and sports) plus the DTC services displayed below:
![Figure 31: Cost of TV bundles and DTC subscriptions [USD/month]; Source: Websearch](https://montaniumresearch.com/wp-content/uploads/2025/09/Charter-34-1024x449.png)
Figure 31: Cost of TV bundles and DTC subscriptions [USD/month]; Source: Websearch
What this essentially means is that all ~150 legacy TV channels, which historically cost over USD 100 to access, are now available for a price of ~35 USD/month, taking into account the individual subscription prices of the DTC offerings. Compared to the past, this seems to be a very competitive offering.
However, consumers with a niche interest in only specific channels will probably still move away from the bundle (or not return if they have already cancelled).
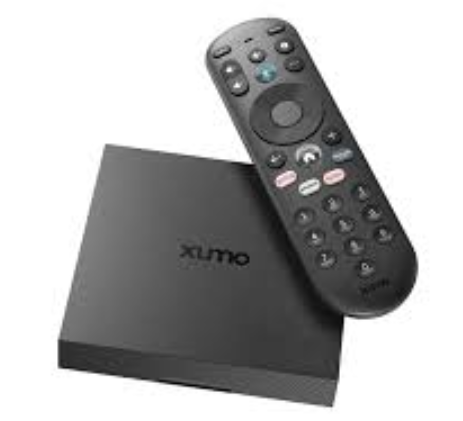
Figure 32: Xumo Stream Box used by Charter, Comcast, Cox to provide access to TV and streaming offerings; Source: Xumo
So, bottom line: While video has become almost negligible from an EBITDA perspective in the meantime, we think that the recent steps might help maintain and even improve the “stickiness” of Charter’s broadband customers, while also helping to reduce the ongoing churn of video subscribers.
However, as what will happen with the bundle cannot be foreseen at this stage, we opted to take a more cautious stance for valuation purposes and assumed a continued churn of video customers (although at a reduced rate).
Pricing Power: Growing ARPU over time
We must acknowledge that, despite strong competitive headwinds, Charter has consistently increased ARPU in recent quarters, particularly for its broadband product.
![Figure 33: Development of ARPU by main product (QoQ) [USD/sub/month]; Source: Charter Comm. Trending Schedule Q2-2025](https://montaniumresearch.com/wp-content/uploads/2025/09/Charter-36-1024x502.png)
Figure 33: Development of ARPU by main product (QoQ) [USD/sub/month]; Source: Charter Comm. Trending Schedule Q2-2025
We believe this increase in broadband ARPU resulted from multiple factors:
- network/product upgrades (packages offering faster speeds and higher data volume)
- service improvements
- bundling with mobile offering
- pricing power (in a lot of markets, Charter is still operating in a pretty much stable duopoly)
As the network upgrade is expected to continue for several quarters, and access options for the new video bundle are still being optimized, we believe that Charter will be able to increase ARPUs modestly over the medium-term.
Overall, the pricing threshold for competitive fiber offerings is relatively high (i.e., fiber operators require higher ARPUs to make their business cases work).
As the following table shows, Charter has quite some room for increases versus fiber:
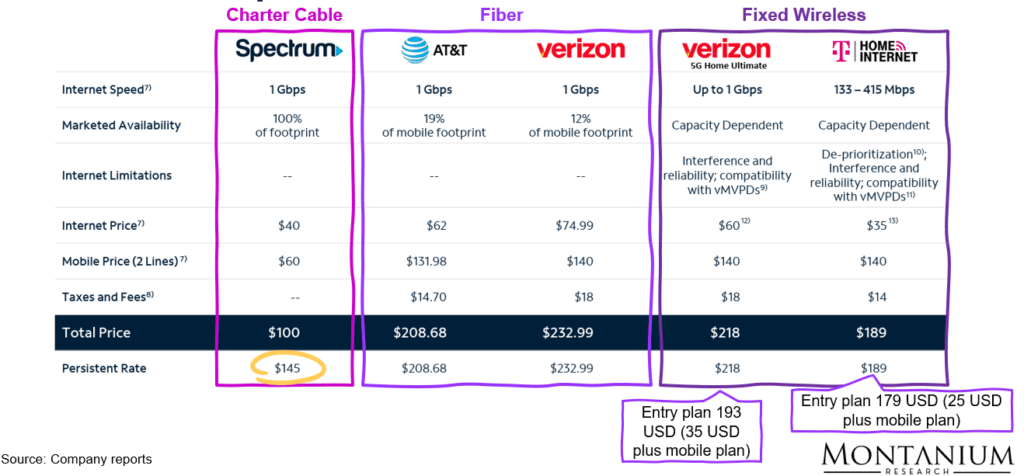
Figure 34: Comparison of broadband and mobile prices; Source: Charter Comm. investor presentation Q2-25
However, on the other hand, T-Mobile has been undercutting Charter with prices as low as 35 USD/sub/month for its standard internet product. There are, however, some reasons to believe that an outright price war can be avoided:
- T-Mobile is targeting FWA growth only in selected (i.e., underutilized) markets. Overlap with Charter’s HFC network might therefore be limited
- Emphasizing the speed, quality, and reliability of Charter’s broadband services can justify higher prices to customers
- Bundling broadband with mobile services can justify higher broadband prices by offering customers perceived added value
- Implementing modest, targeted price increases in select markets and providing discounts in others could mitigate risks while testing customer response (i.e., identifying and targeting customer segments less sensitive to price increases can help maintain ARPU without significant subscriber loss)
To summarize: Given the overall competitive dynamics and the recent historical developments (i.e., the proven ability of Charter to increase ARPUs even under intense competition), we believe that a continued ARPU growth of ~2% per year seems reasonable (impact approximately USD 2–3 billion over a period of 5 years).
Leveling out of Growth and Upgrade Investments starting 2027
A substantial part of Charter’s annual CapEx is transitional. Historically, Charter has invested around USD 1.4 billion per quarter in maintaining its existing HFC network (i.e., core CapEx of approximately USD 5.6 billion per year).
An additional approximately USD 0.4 billion has been invested quarterly into upgrading this network (i.e., DOCSIS 3.1/4.0 rollout).
Taken together, Charter has thus invested around USD 7 bn per year into its existing core infrastructure.
The remaining USD 1 billion per quarter (~USD 4 billion per year) has been spent on network expansions, i.e., creating new passings… particularly as part of the rural expansion initiative.
![Figure 35: CapEx breakdown Charter Communications [USD million]; Source: Charter Comm. Trending Schedule Q2-2025](https://montaniumresearch.com/wp-content/uploads/2025/09/Charter-38-1024x442.png)
Figure 35: CapEx breakdown Charter Communications [USD million]; Source: Charter Comm. Trending Schedule Q2-2025
Once the existing network is upgraded to DOCSIS 4.0 and the rural expansion initiative is finalized by 2026/27, annual CapEx is expected to decrease by approximately USD 4–5 billion. An additional USD 1 billion per year might be released from the normalization of investments at Cox Communications.
This CapEx reduction would almost immediately increase free cash flow by ~20–25 USD/share (~USD 4–5 billion / 197 mn shares)… including the anticipated cash release at Cox even by 25–30 USD/share.
As a result, FCF would nearly double as a result of the expected decrease in CapEx alone.
Capital Allocation: Potential Share Buybacks
Charter has been buying back its own shares quite aggressively in recent years, reducing its share count by ~50% between 2017 and 2024.
![Figure 36: Development of share count Charter between 2015 and today [mn shares outstanding]; Source: Company reports](https://montaniumresearch.com/wp-content/uploads/2025/09/Charter-39-1024x449.png)
Figure 36: Development of share count Charter between 2015 and today [mn shares outstanding]; Source: Company reports
Based on the previous assumptions, the company is likely to generate an annual levered after-tax Free Cash Flow in excess of ~USD 10 billion.
Those USD 10 billion would likely be allocated according to the following capital allocation logic:
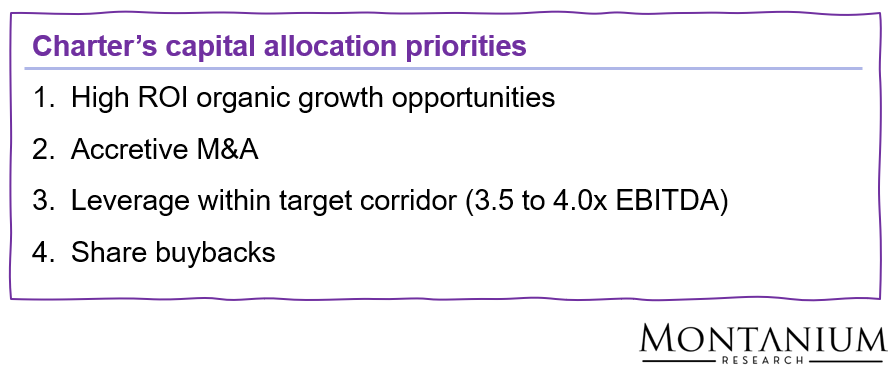
Figure 37: Charter Comm. capital allocation priorities; Source: Capital Market Conference 2025
Let’s go through one by one:
High-ROI organic growth opportunities may be rare going forward. Already today, Charter observes a diminishing opportunity to expand further into rural areas (which currently is the leading organic growth driver).
Accretive M&A largely depends on the availability of suitable targets. It might well be that a meaningful transaction opportunity arises; however, from today’s perspective, nothing is on the horizon.
Pushing the current leverage ratio (~4.2x EBITDA) into the new target corridor of 3.5–4.0x EBITDA should approx. require USD 15 billion over a couple of years (also depending, of course, on the existing debt schedule. Based on Charter’s 2024 balance sheet, approximately USD 13 billion could be spent to extinguish debt due in the coming four years (including 2025).
That theoretically still leaves approximately USD 6 billion per year of FCF to allocate to share buybacks.
Since the beginning of its buyback program in September 2016 through the year ended December 31, 2022, Charter has purchased approximately 149.4 million shares of Class A common stock and Charter Holdings common units in the public market for roughly $68.5 billion, including purchases from Liberty Broadband and A/N. – Charter Comm. Annual report 2022
Now, as the above excerpt from Charter’s 2022 annual report shows, spending several billion USD per year on share buybacks has not been uncommon for the company.
Currently, Charter is buying back shares from Liberty Broadband at a rate of USD 100 million per month.
Now, assuming management spends between USD 1.2 billion and 4.0 billion per year on buybacks (and the share price remains muted for some time), it could buy back between ~4 million and 13 million shares per year (i.e., between ~20 million and 65 million shares over a period of 5 years).
Based on the initial number of shares after the closing of the Liberty and Cox transactions (197 million fully diluted), this could reduce the share count to ~135–175 million shares by ~2030.
Bringing it all Together: Valuation Scenarios and Potential Upside
So, overall, we see the following base case scenario for ~2030:
Based on the assumptions outlined above, Charter—then including Cox—should be able to generate a levered after-tax FCF of ~USD 10–12 billion by 2030.
The following FCF bridge illustrates—on a high level—the expected changes:
![Figure 38: FCF estimate Charter by ~2030 [USD billion]](https://montaniumresearch.com/wp-content/uploads/2025/09/Charter-41-1024x462.png)
Figure 38: FCF estimate Charter by ~2030 [USD billion]
Here is some additional color on the assumptions:
- Pro-forma Charter-Cox: Assuming full realization of cost synergies (USD 0.5 billion) but no additional synergies on the commercial side (which, from our perspective, is a conservative assumption)
- ARPU growth: Annual 2% ARPU growth on USD 55–68 bn baseline revenue; Assuming 40% EBITDA margin
- Subscriber losses: Net ~2 million subscribers lost at ARPU 70–140 USD and 50% EBITDA margin.
- CapEx optimization: CapEx reduction of USD 4–5 bn on the Charter side, stable CapEx assumed for Cox Communications (again a conservative assumption)
Combining the above FCF estimate with the expected share count of ~135–175 million shares, we arrive at a levered after-tax FCF of 55–75 USD/share.
At a constant FCF multiple of around 10x, this would result in a share price of ~550–750 USD/share.
If, finally, the market acknowledges the sustainability of the business model, valuation could increase by another 25% (i.e., share price could increase to ~690–930 USD/share.
So… in an optimistic scenario, this could be a 2.5 to 3.5 times opportunity.
Even in a conservative scenario—no ARPU growth and larger subscriber losses—Charter should genereate a free cash flow north of USD 8 bn (~45 USD/share) to allow for the indicated share repurchases (main drivers then being the CapEx optimization starting in 2027 and the realization of the cost synergies) leading to a conservative valuation of ~450 USD/share.
Potential Catalysts and Risk Factors
We expect the opportunity to become apparent to the market once CapEx levels start to decline materially, which is anticipated to occur in early 2027. In the short-term, a stabilization (or even a slight increase) in broadband subscribers could also lead to a revaluation.
Disclaimer
This document is provided for informational and educational purposes only and does not constitute investment advice, a recommendation, or a solicitation to buy or sell any security or financial instrument. All information, opinions, estimates, and forecasts contained herein reflect the judgment of the author as of the date of publication and are subject to change without notice.
While every effort has been made to ensure the accuracy and completeness of the information, no representation or warranty, express or implied, is made regarding its fairness, accuracy, or completeness. The author and associated entities may have positions in, or may from time to time buy or sell, the securities or financial instruments discussed in this report. Investing in financial instruments involves risks, including the possible loss of principal. Readers should conduct their own independent research and analysis and seek professional advice before making any investment decisions.
Disclosure
The author of this report, Montanium Research], certifies that the views expressed herein accurately reflect their personal views about the securities and issuers discussed. The author has not been compensated by any company or issuer mentioned in this report for preparing or publishing this content.
As of the date of publication, the author does hold a position in the securities mentioned in this report. This disclosure is provided in the interest of full transparency.
Glossary
| Abbreviation | Contextual Meaning |
| ARPU | Average Revenue Per User |
| CAC | Customer Acquisition Cost |
| CapEx | Capital Expenditure |
| CBRS | Citizens Broadband Radio Service (3.5 GHz band) |
| CFROE | Cash Flow Return on Equity |
| CFROI | Cash Flow Return on Investment |
| CLTV | Customer Lifetime Value |
| DOCSIS | Data Over Cable Service Interface Specification (cable modem standard) |
| DSL | Digital Subscriber Line |
| DTC | Direct-to-Consumer (streaming) |
| EBITDA | Earnings Before Interest, Taxes, Depreciation, and Amortization |
| FCF | Free Cash Flow |
| FID | Final Investment Decision |
| FTTB | Fiber-to-the-Building |
| FTTH | Fiber-to-the-Home |
| FWA | Fixed Wireless Access |
| HFC | Hybrid Fiber-Coaxial |
| IRR | Internal Rate of Return |
| LT | Long-term |
| LTE | Long-Term Evolution (4G wireless standard) |
| MVNO | Mobile Virtual Network Operator |
| MNO | Mobile Network Operator |